Technical Analysis of Shares – Tools | Charts | Investment Strategies
- Blog|Company Law|
- 11 Min Read
- By Taxmann
- |
- Last Updated on 18 March, 2025
Latest from Taxmann

Technical Analysis of Shares refers to a method of evaluating and predicting stock price movements based on historical price and volume data. It operates on the premise that stock prices move in trends and patterns, which can be analyzed to forecast future price movements. Unlike fundamental analysis, which assesses a company's financial health and intrinsic value, technical analysis focuses on price charts, trading volume, and market indicators to identify buy and sell signals.
Table of Contents
- Technical Analysis
- Difference Between Fundamental Analysis and Technical Analysis
- Basic Tenets (Propositions) of Technical Analysis
- Tools of Technical Analysis
Check out Taxmann's Security Analysis & Portfolio Management | Text and Cases which is a definitive guide to mastering investment management in today's complex financial environment. It offers a perfect blend of Indian and global perspectives with actionable insights into risk-return analysis, portfolio management, and investor protection. Designed for students, professionals, and researchers, the book stands out with its practical tools like case studies, solved problems, and self-assessment exercises. The twelve thoughtfully structured chapters cover securities markets, valuation techniques, portfolio strategies, financial derivatives, and investor protection reforms.
1. Technical Analysis
Technical analysis is based on the premise that “history repeats itself” and hence movement in stock prices follow an established trend which can be gauged from past price and volume data. As per Technical Analysis future price behaviour can be predicted on the basis of past price analysis. Technical analysis involves the study of various charts, ratios and patterns to predict future direction of stock prices. It helps in answering the questions like “Is it the right time to buy a share?” or “Is it the right time to sell a share?” Hence once it is decided to invest in the shares of a particular company, the right timing of investment can be decided on the basis of technical analysis.
2. Difference Between Fundamental Analysis and Technical Analysis
Two approaches to security valuation fundamental analysis and technical analysis can be distinguished on the following basis:
- Meaning and basic philosophy – As per fundamental analysis, the share price should be equal to its intrinsic value in long term. Intrinsic value of a share is equal to the present value all future expected cash inflows from the share. Technical analysis is based on the premise that ‘history repeats itself’ and hence stock prices can be predicted based on past price and volume data. The basic philosophy behind fundamental analysis is that every security has a real worth. If its price is less than its real worth then an investor can earn superior returns by investing in it. On the other hand, the basic philosophy of Technical analysis is that the share prices move in trends and patterns which can be exploited by investors to predict near future price movements.
- Objectives – In case of fundamental analysis the main objective is to determine the intrinsic value (or true worth) of a security. The main objective of Technical analysis is to identify future trend in security prices.
- Source of information – Fundamental analysis is based on the information related to Economy, industry and company fundamentals. EIC framework is the backbone of fundamental analysis. The information regarding economy and industry is obtained from government reports and database. Information regarding company analysis is obtained from the annual financial statements of the company concerned. Here we do not use stock price data to analyse a stock. Technical analysis is based on the analysis of past stock prices and volume data so as to predict future prices. Hence technical analysis requires information which is easily available from the stock market i.e. prices and volume. Therefore sometimes it is said that fundamental analysis is based on external data while technical analysis is based on data which is internal to stock market.
- Types of information – Both fundamental analysis and technical analysis are primarily based on secondary data. But in case of fundamental analysis the information required is extensive. Here the fundamental analyst requires macroeconomic data such as GDP growth rate, inflation rate, interest rate etc., industry data such as nature of industry, competition, growth stage etc. as well as company specific data such as sales, profitability, liquidity etc. Technical analysis, on the other hand, requires data related to securities only, such as security prices, volume, benchmark index data and so on.
- Tools and Techniques for analysis – Fundamental analysis is based on the assessment of economy, industry and company level data. Hence a variety of accounting and statistical tools and techniques such as ratio analysis, discounted cash flow analysis, regression analysis, probability distribution method, sensitivity analysis (what if analysis), and econometric modeling is used in case of fundamental analysis. Technical analysis of the shares on the other hand is based primarily on trend analysis and chart patterns.
- Investment decision (Buy-Sell signals) – In fundamental analysis an investor is advised to buy a stock if its market price is lower than the intrinsic value. If market price is higher than the intrinsic value then the ‘sell’ advice is given. In technical analysis of shares, buy and sell signals are based on the analysis of various chart patterns and market as well as stock indicators. If stock prices are expected to rise in near future, a buy signal is advised. If stock prices are expected to decline in near future a sell signal is given.
- Where to Invest vs. When to invest – Fundamental analysis answers the question – Is this the right security to invest or Where to invest? Hence using fundamental analysis, one can identify the securities which are worth investing. Technical analysis is useful in timing the market i.e. When to buy or sell? Hence fundamental and technical analysis are not mutually exclusive. They are complementary and a wise investment decision requires both – i.e. the right kind of securities and right time of investment.
- Time horizon – Fundamental analysis determines intrinsic value of a share and hence the investment decisions based on fundamental analysis is done for a relatively longer period. Technical analysis is used to predict stock prices in near future. Hence technical analysis of shares is useful in short term investment making such as traders.
- Emphasis – In case of fundamental analysis, the emphasis is on the economic, industry and company fundamentals. It is not driven by market forces or investor behaviour. Hence the intrinsic value of a share will change only if there is a change in these fundamental factors. Technical analysis of shares, on the other hand, is based on market movement of prices as determined by demand and supply forces. Hence investors’ behaviour does affect technical analysis. In recent times it has been shown that in stock market, investors do not behave rationally. Investors are irrational and are subject to a number of behavioural biases such as- overconfidence, regret avoidance, loss aversion etc. Hence a new area of research in finance i.e. Behavioural Finance has recently been developed.
- Who uses – Fundamental analysis is used primarily by long term investors whereas technical analysis is used primarily by speculators or short term traders in the market.
As explained above there are many points of differences between fundamental analysis and technical analysis of shares. These two approaches of security valuation are fundamentally different. But it does not mean that fundamental and technical analysis are mutually exclusive. They are complementary as a wise investment decision requires both – i.e. the right kind of securities and right time of investment. Fundamental analysis helps in identification of the right type of securities i.e. securities having higher real worth or intrinsic value than the market price. Technical analysis of shares supplements fundamental analysis in terms of timing the market. It can be used wisely to decide about the right time to buy or sell.

3. Basic Tenets (Propositions) of Technical Analysis
Technical analysis is based on certain tenets, premises or propositions. Technicians do not consider value in the sense in which fundamentalists use it. The technicians believe that forces of demand and supply are reflected in the patterns of price and volume trading. By examination of these patterns they predict whether prices will move up or down. Thus technicians believe that price fluctuations reflect logical and emotional forces. The basic tenets or premises of technical analysis are:
- The price of a security is determined by the demand and supply forces operating in a market.
- Prices tend to move in trends over long term. This long term trend sets the direction of market prices.
- Price fluctuations reflect logical and emotional forces.
- Price movements, whatever their cause, once in force persist for some period of time and can be detected.
- The trends in security prices may reverse due to shift in demand and supply.
- The changes in demand and supply can be predicted well in advance with the help of charts and technical tools.
Hence the real task of a Technical analyst is to
- Identify the trend and
- Recognize when one trend comes to an end and prices start moving in the opposite direction.
For this, technical analyst uses a number of charts, patterns and technical indicators which are discussed below. It must be noted that charts are the basic tools for technical analysis of shares.
4. Tools of Technical Analysis
Technical analysis can be performed both at the market level and at individual company level using various types of charts, ratios, patterns or indicators. Here we will examine market indicators and individual stock indicators separately.
4.1 Charts
Charts are the basic tools for performing technical analysis. It provides a visual assistance to the technical analyst in detecting evolving and changing patterns of price behaviour. Charts may be of various types such as Line chart, Bar chart, Point and Figure Chart and Candlestick chart. It must be noted that charts are useful both in the analysis of individual securities as well as market movement analysis. On a particular day, the price of a share varies many times. It is difficult to plot all the prices prevailing for a particular stock on a particular day. Therefore generally the following four prices are of interest to an investor- Open, High, Low and Close.
Open Price – Open price is the price at which the trading on a share starts on a particular day.
High Price – High price is the highest price at which the share has been traded on a particular day.
Low Price – Low price is the lowest price at which the share has been traded on a particular day.
Close Price – Close price is the price at which trading on a share closes on a particular day.
There are various types of charts which are used in technical analysis.
- Line chart
- Bar chart
- Bar chart of prices with volume
- Point and figure chart
- Candlestick chart
These charts are explained below:
i. Line Chart – On a line chart X axis shows the time or number of days/week. On Y axis stock prices are shown. On a line chart only closing prices of a stock are shown. They are connected with each other successively with straight lines as shown below. The stock prices on five days are Rs. 14, 15, 14, 17 and 12.
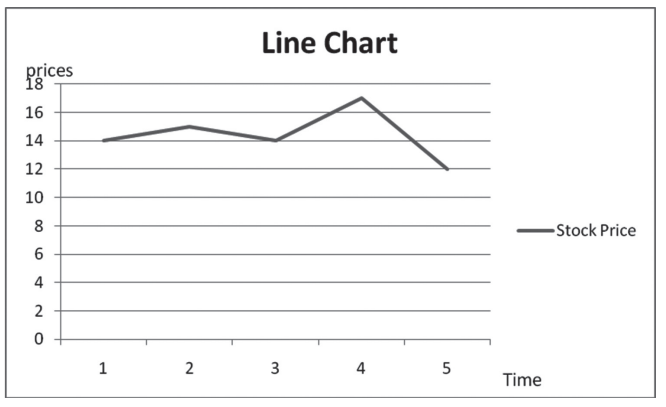
Although line chart is convenient to draw, it does not reveal anything about the intraday volatility of the stock price. It shows only the closing prices and not other prices such as high price, low price or open price.
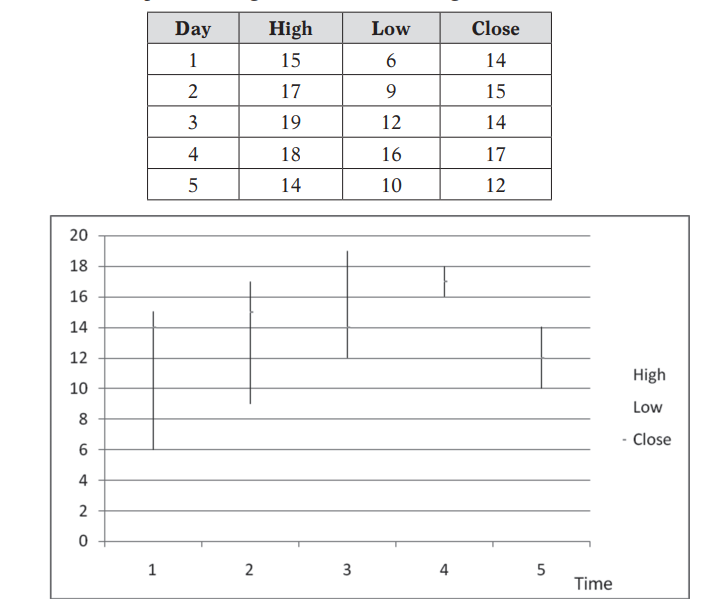
ii. Bar Chart – A ‘Bar chart’ shows high, low and closing prices of a stock every day. Open price of a day is generally equal to the close price of the previous day. Hence it is generally not shown on a bar chart. But if required one can also show open price of the share in a bar chart. On a bar chart X axis show time while Y axis shows stock prices. The length of the bar shows the range of price i.e. the highest price minus lowest price, in a particular day and hence if bar lengths increase overtime, it may be regarded as a signal of increasing stock volatility. One bar is placed every day and closing and opening prices may be depicted with some signs such as – or X. Below a bar chart is shown using the stock price data given in the following table.
iii. Point and Figure Chart – It is a chart made up of X and O’s. X is placed for increase and O for decrease in stock price. A buy signal is implied when X lines are moving up after every O line. If O lines are going down after every X line then a sell signal is triggered. In this chart the axis do not represent time or price level, rather they just show the directional movement of prices irrespective of the quantity of change.
E.g. A stock’s price over the past 30 days is recorded as Rs. 20, 25, 28, 26, 25, 35, 37, 40, 42, 38, 35, 37, 39, 41, 34, 28, 25, 37, 40, 38, 36, 34, 36, 39, 41, 45, 43, 42, 40, 38.
The point and figure chart will appear as shown below:
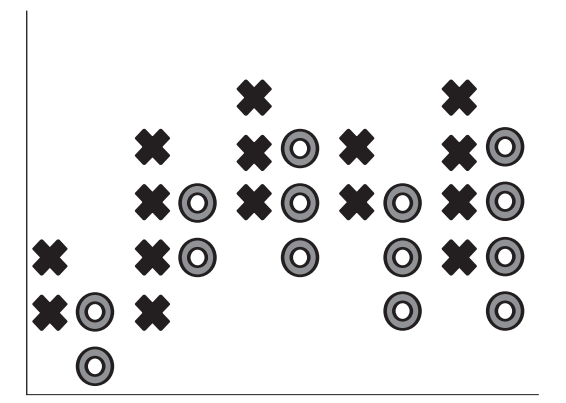
It must be noted that whenever there is a change in price X or O are placed. The columns are changed when there is a change in direction i.e. from increasing prices if the price starts declining then we switched to second column and indicator O. After that the price starts increasing therefore we shifted to third column and put X signs for every increase.
The main advantage of such a chart pattern is that it can compress large volumes of data in a small group which can be used in analysis.
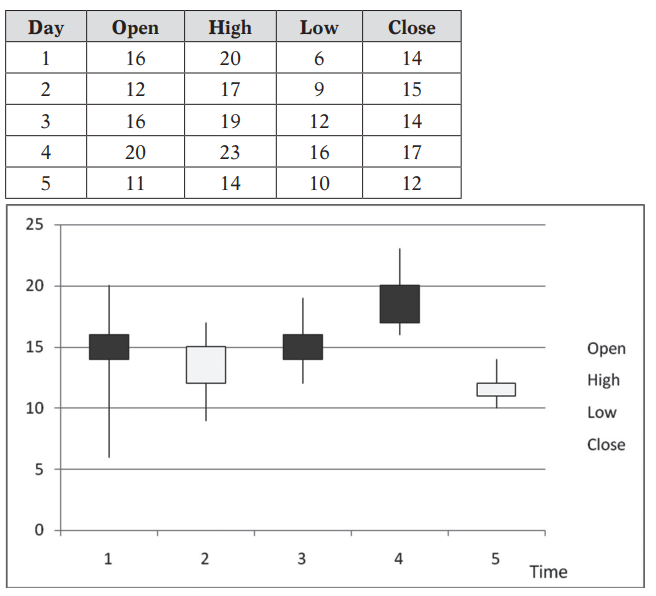
iv. Candlesticks Charts – As the name suggests this chart type shows a candle for every day price movements. It is a chart pattern which shows four prices – open, close, high and low. If close price is lower than open price then the box is filled with black colour otherwise left empty. An increasingly dark candlesticks are bearish indicators. On X axis we measure time and on Y axis we measure stock prices. This chart pattern provides a bird’s eye view as to the movement of stock prices – both intraday and inter day.
Below, candlesticks are shown for the following 5 days.
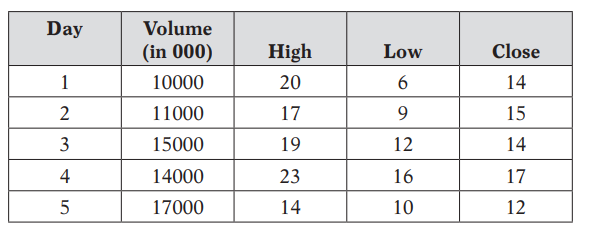
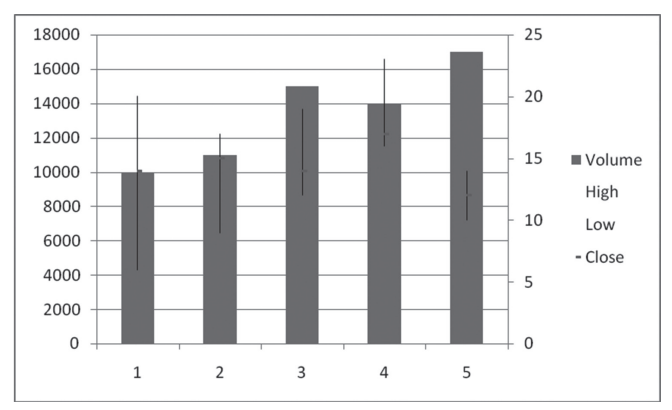
v. Price and Volume Chart – Price-volume chart shows the high, low and close price of a share along with its volume in the same chart. The utility of this chart is that it provides information about the volume of trading regarding that share besides showing the relevant prices. Price and volume chart for the data given in the following table can be depicted as shown below.
4.2 Technical Indicators and Technical Chart Patterns
A number of technical indicators and chart patterns are used by technical analysts. Some important indicators and chart patterns are discussed blow:
Market indicators – Market indicators are charts, or trends which provide the general direction of the market. It covers the following theories or indicators:
- Dow Theory – Charles Dow, the grandfather of technical analysis, propounded what is popularly known as Dow theory now. Dow theory is based on the assumption that stock market does not move on ran- dom basis rather there are set trends which can detect the direction of market movement. According to this theory in any type of market; whether bullish or bearish, three trends are simultaneously at work- the primary trend, the intermediate trend and the minor trend:
-
- Primary trend is the long term trend over a period lasting for more than one year. This trend sets the overall direction of the market. If primary trend is upward then bull market is in operation whereas if primary trend is downward then the market is bearish.
- Intermediate trend, on the other hand lasts for a few months and operate in the opposite direction of primary trend. If the primary trend is upward then intermediate trend will be downward movement and vice versa. Therefore intermediate trends are also known as “secondary corrections”.
Disclaimer: The content/information published on the website is only for general information of the user and shall not be construed as legal advice. While the Taxmann has exercised reasonable efforts to ensure the veracity of information/content published, Taxmann shall be under no liability in any manner whatsoever for incorrect information, if any.
Taxmann Publications has a dedicated in-house Research & Editorial Team. This team consists of a team of Chartered Accountants, Company Secretaries, and Lawyers. This team works under the guidance and supervision of editor-in-chief Mr Rakesh Bhargava.
The Research and Editorial Team is responsible for developing reliable and accurate content for the readers. The team follows the six-sigma approach to achieve the benchmark of zero error in its publications and research platforms. The team ensures that the following publication guidelines are thoroughly followed while developing the content:
- The statutory material is obtained only from the authorized and reliable sources
- All the latest developments in the judicial and legislative fields are covered
- Prepare the analytical write-ups on current, controversial, and important issues to help the readers to understand the concept and its implications
- Every content published by Taxmann is complete, accurate and lucid
- All evidence-based statements are supported with proper reference to Section, Circular No., Notification No. or citations
- The golden rules of grammar, style and consistency are thoroughly followed
- Font and size that’s easy to read and remain consistent across all imprint and digital publications are applied

