Practical Insights on Data Summarization and Visualization Strategies
- Other Laws|Blog|
- 7 Min Read
- By Taxmann
- |
- Last Updated on 15 May, 2024
Latest from Taxmann

What is Data Summarization?

Data Summarization is the key process in data analysis that helps in understanding and communicating insights from complex datasets. This involves reducing the volume of data to its main points or essential information. The goal is to make the data easier to understand without losing critical information. Summarization can be done through various techniques, such as:
– Statistical Summaries: Using measures like mean, median, mode, standard deviation, and quartiles to describe the central tendency and spread of data.
– Aggregation: Combining data into summaries like totals, averages, or counts, often for specific groups or categories.
– Dimensionality Reduction: Techniques like Principal Component Analysis (PCA) reduce the number of variables in the data while retaining the essential information.
– Text Summarization: Using natural language processing to condense large texts into key sentences or paragraphs.
Table of Contents
Check out Taxmann's Business Analytics which underscores the pivotal role of data in the contemporary business landscape, blending theoretical knowledge with practical application to prepare students and professionals for data analysis and strategic implementation. It aligns with the UGCF 2022 syllabus under the National Education Policy of the University of Delhi. Covering a wide array of topics from data preparation to ethics in business analytics, it integrates tools like MS Excel, Tableau, and R for comprehensive learning in business analytics.
1. Introduction
Today, the world is drowning in the sea of data, where data transfers take place every one millionth of a second. As per Statista 2022 report, over 90% data of world has been generated merely, in past two years. This is credited to the ever-increasing size of world internet users, web searches, explosion of smart devices, online services, social media, and digital media etc. Drawing on the same report, there are approximately 22 billion connected smart devices worldwide, and is estimated to reach 50 billion by the year 2030.
Data is a valuable resource for every business across the sectors. On a day-to-day basis, businesses came across diverse types of data like feature rich data, large scale data, and high value data etc. Businesses leverage these information intensive data sets to devise strategies for their organisations. For example, various leading apparel companies, retail companies, and food companies etc. had gigantic amount of data in the form of customer information, product details, promotional activities and so on. These companies leverage this data to devise customised promotion strategies.
Well timed interpretation and comprehension of the data enables organisations in numerous ways. For instance, expanding customer base, devising business strategies, developing brand loyalty, setting competitive prices, cutting down costs, and improving overall efficiency etc.
Despite, the numerous advantages that a data offers, most of the companies are unable to take the full advantage of their data due to following reasons:
- It is practically not feasible to analyse such large volume of data viz. real time data, current data, or historical data. This is where data summarization and visualization prove useful. The crisp, insightful, and comprehensive summaries of the data help firm to identify the existing opportunities and device strategies accordingly.
- Also, in the realistic world, things are variable. To understand or get an idea of a situation, one needs to take several measurements. After taking these several measurements, they need to summarise the results and make meaningful inferences therefrom.

2. Data Summarization
Data summarization refers presenting a compact description of a dataset. In other words, data summarization is the presentation of a dataset in an easy, informative, and comprehensive manner. It can be contemplated as abridged form of the dataset wherein the data is compressed into smaller sets while maintaining the maximum possible information. Data summarization is a meticulously performed summary that is obtained from the entire data set and will divulge significant patterns and trends in a clarified manner.
Data summarization is the foremost step of data mining and helps in choosing an appreciate statistical tool or technique based on the trends put on view by summarization. Some examples where data summarization can act as an auxiliary are as following:
- A media house ought to find out how effectively its various channels are performing on the basis of certain variables like viewership, number of shows aired, and target audience etc.
- The HR manager of a company wants to keep a record of the company’s workforce and monitor them based on various attributes like vacancies, employee turnover, and transfers etc.
- A pharmaceutical company wants to keep a track of its MRs (Medical representative) on the basis of variables like targets achieved, coverage, and outreach etc.
- A retail company required to test the market sentiment for its newest product based on the data gathered from various social networking accounts of the consumers.
In all the above examples data summarization tools and techniques come to rescue by providing deep insights of the situation.
2.1 Types of data summarization
Based on the statistical operations, there are three ways in which data can be summarised (Figure 1).
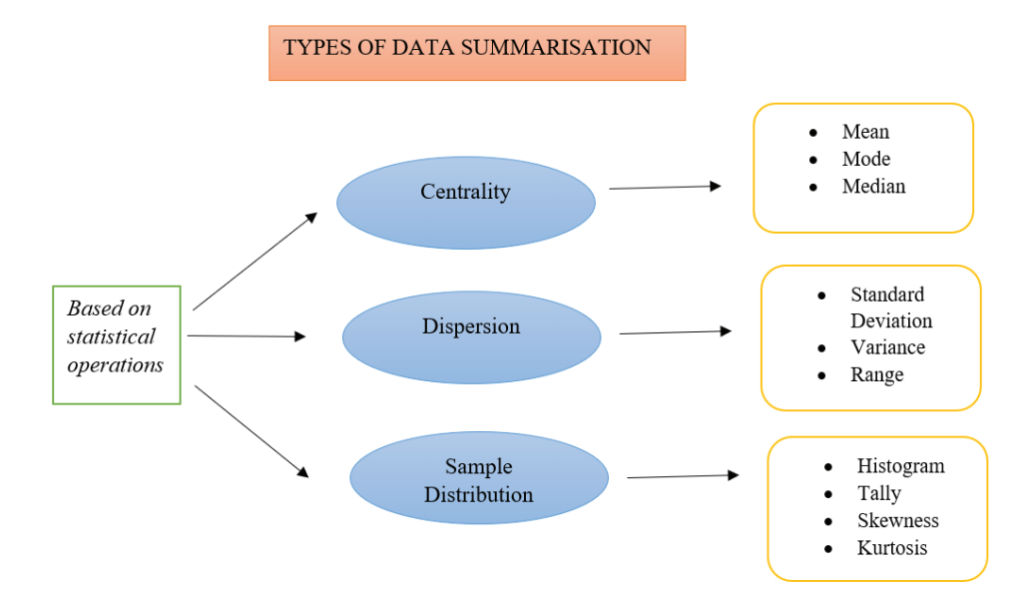
Figure 1: Types of Data Summarization
These are discussed as follows:
1. Based on Centrality
A data can be summarised on the basis of its centrality. Centrality of a data describes the centre or middle value of the data set. In other words, it ascertains one central value around which all other values of a dataset revolve. The other name for centrality is ‘average.’
There several ways to find the centrality of a data. However, the most popular ones are mean, mode and median. These three summarises the distribution of the dataset.
- Mean
Mean is used to calculate the numerical average of a dataset. Arithmetic mean is calculated by adding all the values of the given dataset and dividing it by the by number of items therein. The mathematical formula is as follows:
x = ∑x/n
Here, ‘∑’ represents ‘summation’
‘n’ represents ‘number of items’
The following steps are used to calculate mean using MS-Excel:
Step 1: Click on an empty cell
Step 2: Type ‘=AVERAGE (cell range)’ for example: (A1:A15)
Step 3: Press ‘ENTER’ and mean will be displayed.
For example, Calculate the average marks of the students (out of 15) from the below given
sample:
12, 13, 15, 12, 10, 13, 14, 12, 10, 12
Step 1: Click on empty cell (Figure 2)
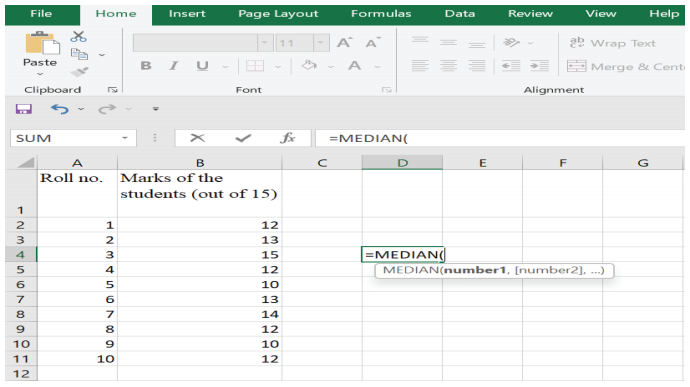
Figure 2
Step 2: Type ‘=AVERAGE (B2:B11) (Figure 3)
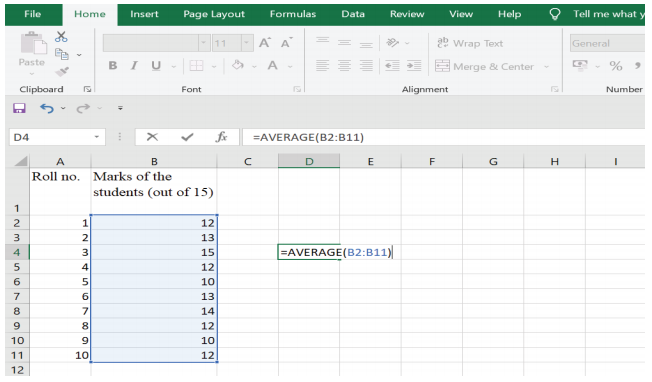
Figure 3
Step 3: Press ‘ENTER’. Mean of the dataset is 12.3 (Figure 4)
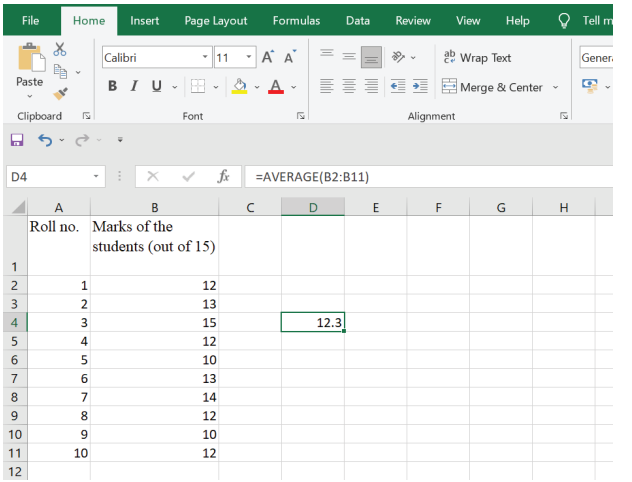
Figure 4
- Mode
Mode refers to the most recurring value in the sample. In other words, it refers to the most frequent number of the given dataset. Mode is comparatively less preferred in statistical analysis. Although it can be calculated for any type of sample, but it is mostly used where the sample size is large or the given values are integers.
The following steps are used to calculate mean using MS-Excel:
Step 1: Click on an empty cell
Step 2: Type ‘=MODE (cell range)’ for example: (C1: C15)
Step 3: Press ‘ENTER’ and MODE will be displayed.
For example, following are marks of 10 students in the class:
12, 13, 15, 12, 10, 13, 14, 12, 10, 12
Calculate its mode.
Step 1: Click on the empty cell (Figure 5)
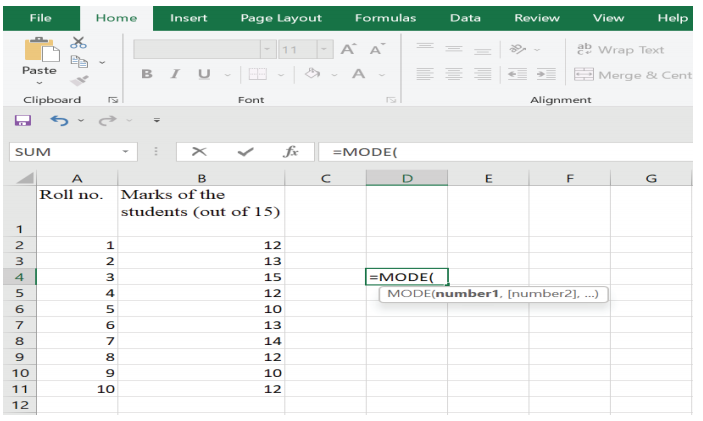
Figure 5
Step 2: Type =MODE (B2: B11) (Figure 6)
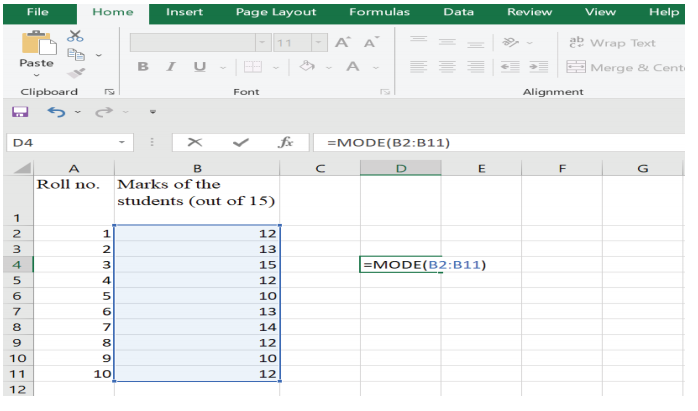
Figure 6
Step 3: Press ‘ENTER’ MODE= 12 (Figure 7)
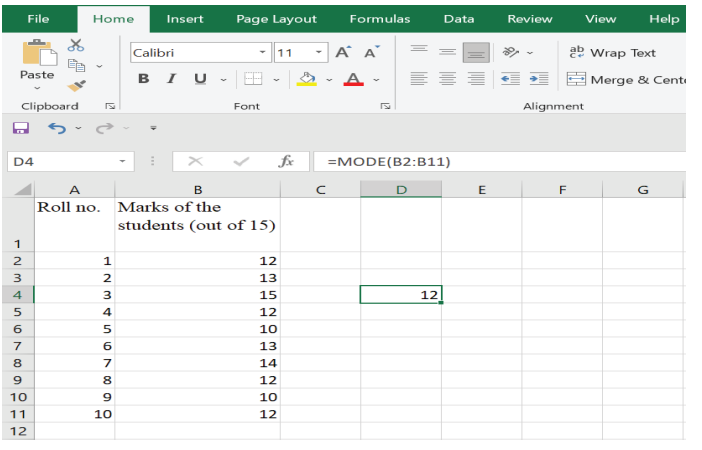
Figure 7
- Median
Median refers to the middle value of the series when arranged in ascending or descending order. When the distribution is normal, the mean and median tend to coincide.
The following steps are used to calculate median using MS-Excel:
Step 1: Click on an empty cell
Step 2: Type ‘=MEDIAN (cell range)’ for example: (C1: C15)
Step 3: Press ‘ENTER’ and MEDIAN will be displayed.
For example, following is the marks of 10 students in the class:
12, 13, 15, 12, 10, 13, 14, 12, 10, 12
Step 1: Click on an empty cell (Figure 8)
Figure 8
Step 2: Type =MEDIAN (B2: B11) (Figure 9)
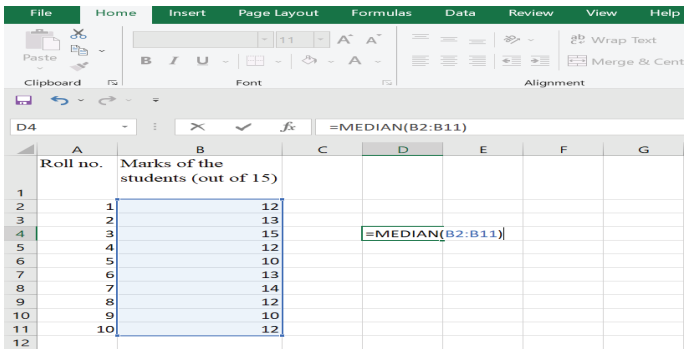
Figure 9
Step 3: Press ENTER. Median is 12 (Figure 10)
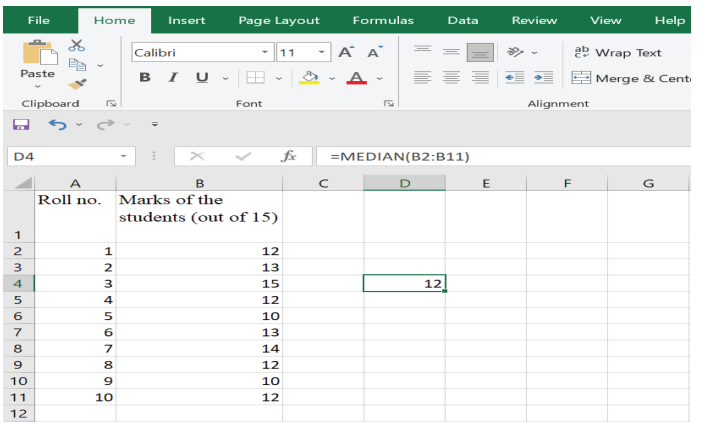
Figure 10
2. Based on Dispersion
The term ‘dispersion’ means ‘spread.’ To elaborate, dispersion means how scattered the sample values are around the mean. It shows the variability present within the given data. If the values are scattered far away from the mean, then the dispersion of the sample is said to be low. While values closer to average means low dispersion.
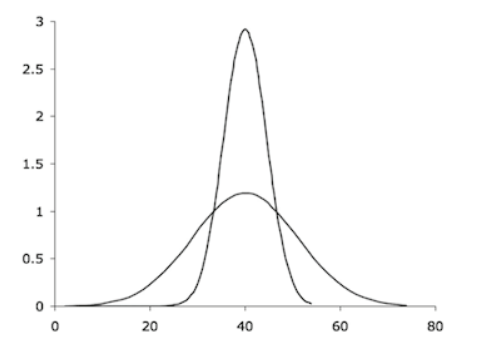
Figure 11: Symmetrical Distribution
Figure 11 depicts two normally distributed samples i.e., symmetrical distributions. However, the principle of dispersion remains the same for any shape of the distribution. Different measures of dispersion are considered for different data distribution.
Various measures of dispersion include the following:
- Standard Deviation (SD)
Standard deviation is the most used measure of dispersion. It is used in normally distributed data and shows how spread the values are from the mean. To rephrase, it shows extra small or extra-large values of the data. Thus, gives an understanding of how scattered a data is. It is also known as ‘average deviation’ from mean. The formula for SD is
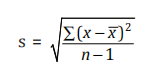
Here, s represents sample SD
Generally, a sample is taken from a larger population. Thus, a sample standard deviation
(s) is estimated in most of the statistical analyses. Also, n-1 is taken as the denominator. However, in case of population SD, also known as ‘True SD,’ standard deviation is denoted by the symbol sigma ‘σ’ and the denominator is taken as ‘n.’ Here, -1 in the divisor is considered as a ‘compensation factor’ as ‘n’ larger and thus closer to the population. In such a case, subtracting 1 from ‘n’ does not affect the result much.
The following steps are used to calculate SD using MS-Excel:
Step 1: Click on an empty cell
Step 2: Type ‘=STDEV.S (cell range)’
Step 3: Press ‘ENTER’ and SD will be displayed.
Disclaimer: The content/information published on the website is only for general information of the user and shall not be construed as legal advice. While the Taxmann has exercised reasonable efforts to ensure the veracity of information/content published, Taxmann shall be under no liability in any manner whatsoever for incorrect information, if any.

