Portfolio Performance Evaluation – Methods | Benchmarks
- Blog|Company Law|
- 11 Min Read
- By Taxmann
- |
- Last Updated on 15 March, 2025
Latest from Taxmann

Portfolio Performance Evaluation is the process of regularly measuring and analyzing the returns, risk profile, and overall effectiveness of a chosen portfolio. It helps investors gauge whether their portfolio is meeting the desired financial goals and staying aligned with risk preferences. By comparing actual performance against a benchmark portfolio or index, investors can determine if their chosen investments are outperforming or underperforming the market.
Various methods are used to evaluate portfolio performance. Absolute Return Measures compare total returns without considering risk, while Risk-Adjusted Measures like Sharpe Ratio, Treynor’s Ratio, and Jensen’s Alpha incorporate the element of risk. Through these tools, an investor can identify if the returns justify the underlying risk and decide whether any adjustments are required to optimize the portfolio for future market conditions.
Table of Contents
- Portfolio Performance Evaluation
- Risk-Adjusted Measures or Techniques for Evaluating Performance of Portfolios
- Mutual Funds
- Evolution of Mutual Funds in India
Check out Taxmann's Investment Management which comprehensively addresses foundational and advanced topics, spanning risk-return basics, bond/equity valuation, portfolio construction, and mutual funds/derivatives. It integrates the latest financial developments and regulations, presenting them in a student-friendly format with bullet-point learning outcomes and exam-oriented content. Authored by seasoned academics, it bridges theory and practice through project work, case studies, and 260+ solved examples. Organised into five units, the book aligns closely with university curricula, ensuring a thorough, hands-on learning experience for undergraduate Commerce and Management students.
The selection of the optimal portfolio is based on Markowitz portfolio theory and Capital market theory leading to the development of Capital Asset Pricing Model. There are two types of portfolio management. One, is Passive Management in which the investor invests in the broad market index and does not perform any security analysis or select individual securities. Hence analysis of securities is not required if one is a passive investor. A passive investor simply invests in the index and holds it in order to earn commensurate return. Second is Active Management, in which the investor is actively engaged in the analysis and selection of securities so as to earn superior returns. The idea here is to invest in undervalued stocks or assets so as to reap higher gains. We have seen in the previous chapter that in an efficient market, Passive Management is the best strategy as no one can consistently outperform the market. In an efficient market all the securities are fairly priced and hence there are no underpriced assets. Therefore security analysis and selection is of no use. One should simply invest in the market index. However in real world the markets are not efficient as assumed under Capital Market Theory and CAPM. Hence there is always a room for Active Management.
Now once an investor has selected his portfolio, the next step is to evaluate the performance of the portfolio and, if needed, revise the portfolio according to the changing circumstances and investment objectives. This chapter deals with the methods of portfolio performance evaluation. Further we provide discussion on Mutual Funds. A Mutual Fund scheme acts as a portfolio of securities and hence a mutual fund may be regarded as a portfolio.
1. Portfolio Performance Evaluation
Once an investor selects a portfolio it is necessary that he evaluates its portfolio periodically so as to achieve his financial goals. If there is no performance evaluation, then it is not necessary that the portfolio is performing as expected. This may be due to various reasons such as changes in the investment environment or unexpected performance of the companies whose securities are held etc. An investor may hold more than one portfolios of assets such as equity portfolio comprising only shares and bond portfolio comprising only bonds. The overall portfolio of an investor is the combination of all these portfolios. Hence it is necessary for every investor to evaluate the performance of various portfolios that he holds. In case of performance evaluation it is necessary to have a benchmark portfolio against which the performance of the portfolio will be evaluated. A benchmark is the standard portfolio which provides minimum performance standards. If the given portfolio performs better than the benchmark portfolio, then the given portfolio is outperformer. On the other hand if the given portfolio performs less than the benchmark portfolio, then the given portfolio is underperformer. There are many methods or techniques for evaluating the performance of portfolios. They are categorised as – Absolute return measure and Risk Adjusted Measures or Methods.

- Absolute return measure – In absolute return measure we compare the absolute returns of various portfolios as well as benchmark portfolio. There is no consideration of risk in case of performance evaluation using this measure. Portfolio having highest return is the top performer while the one giving least return is the poorest performer. For example if the returns on two portfolios P and Q are 24% and 17% respectively then portfolio P is a better performer than portfolio Q as per Absolute Return Measure. However the serious limitation of this measure is that it does not consider risk at all. It compares returns regardless of the underlying risks. It is not acceptable as different portfolios may have differing degrees of risk. For example if the risk of portfolio P is very high say 30% while the risk of Portfolio Q is very low say 5%, then the two portfolios cannot be compared just on the basis of returns. Hence we need some risk adjusted measures to evaluate the performance of portfolios.
- Risk Adjusted Measures – Risk adjusted measures adjust the return from a portfolio for the underlying risk. These measures are Sharpe ratio (or index), Treynor’s Ratio (or index) and Jensen’s Alpha. They are discussed below:
2. Risk-Adjusted Measures or Techniques for Evaluating Performance of Portfolios
2.1 Sharpe’s Measure – (or Sharpe Ratio or Sharpe Index)
William Sharpe developed a composite measure to evaluate the performance of mutual funds. It expresses risk premium (or excess return) of the portfolio in terms of per unit of total risk. The excess return or risk premium is the excess of actual return over the risk free return. Total risk is measured by the standard deviation of the returns from the portfolio. It is also termed as Reward to Volatility ratio. It is calculated as under:
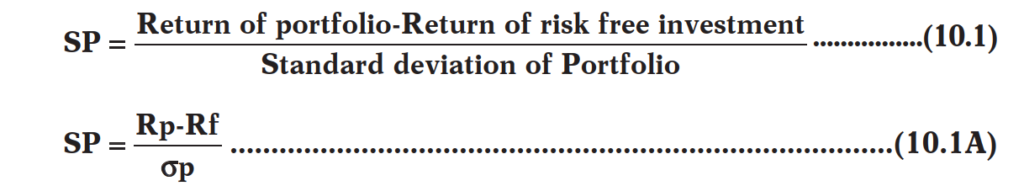
Thus Sharpe ratio converts risk premium into risk premium per unit of risk. The higher the Sharpe’s ratio, the better it is.
Ranking of Portfolios
When we have to rank the portfolios we give first rank to the one having highest Sharpe ratio and the last rank to the one having lowest Sharpe ratio. Hence ranking of portfolios can be done in the descending order of Sharpe Ratio.
Whether Outperformed or Underperformed
In order to find out whether the portfolio has outperformed or underperformed we need some benchmark portfolio say the market portfolio. If the Sharpe ratio of the given portfolio is higher than the Sharpe ratio of Market portfolio (or any other benchmark portfolio) then, we say that the given portfolio has outperformed the market or is an outperformer. On the other hand if the Sharpe ratio of the given portfolio is lower than the Sharpe ratio of Market portfolio (or any other benchmark portfolio) then, we say that the given portfolio has underperformed the market or is an underperformer.
2.2 Treynor’s Measure (or Treynor’s Ratio)
Another risk adjusted measure is Treynor’s ratio. Treynor’s measure of portfolio performance, like Sharpe, measures portfolio’s risk premium return per unit of risk, but it uses systematic risk as indicated by beta factor. Treynor’s ratio (Tp) is calculated as under:
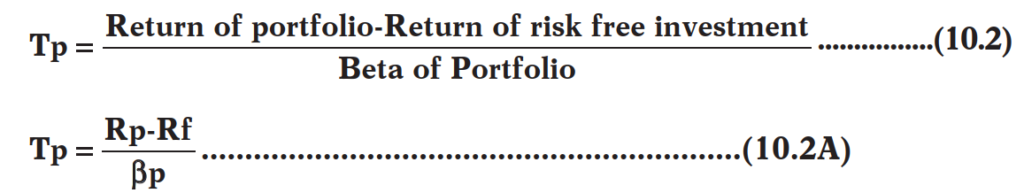
A portfolio with higher Treynor’s ratio is considered as a better performer than a portfolio with lesser Treynor’s ratio. Hence the higher the Treynor’s ratio the better it is.
Ranking of Portfolios
When we have to rank the portfolios we give first rank to the one having highest Treynor’s ratio and the last rank to the one having lowest Treynor’s ratio. Hence ranking of portfolios can be done in the descending order of Treynor’s Ratio.
Whether Outperformed or Underperformed
In order to find out whether the portfolio has outperformed or underperformed we need some benchmark portfolio say the market portfolio. If the Treynor’s ratio of the given portfolio is higher than the Treynor’s ratio of Market portfolio (or any other benchmark portfolio) then, we say that the given portfolio has outperformed the market or is an outperformer. On the other hand if the Treynor’s ratio of the given portfolio is lower than the Treynor’s of Market portfolio (or any other benchmark portfolio) then, we say that the given portfolio has underperformed the market or is an underperformer.
It must be noted that the Treynor’s ratio of Market portfolio is always equal to its risk premium or excess return. This is because the beta factor of the market portfolio is always one. Hence in the denominator of the formula of Treynor’s ratio we have 1.
Can Sharpe Ratio and Treynor’s Ratio Give Contradictory Results?
It must be noted that Sharpe ratio uses total risk while Treynor’s ratio uses Systematic risk in the denominator. Total risk comprises of systematic as well as unsystematic risk. If there is no unsystematic risk, especially in case of well and perfectly diversified portfolio, then the total risk and systematic risk will be same and hence Sharpe ratio and Treynor ratio will provide similar results.
However, it is quite possible that the total risk of a portfolio is not equal to its systematic risk only. It may also comprise of unsystematic risk. Especially in case of not so diversified portfolios we find that there is presence of significant amount of unsystematic risk. In such case Sharpe ratio and Treynor ratio may provide contradictory results. This is explained in Illustration 10.1.
2.3 Jensen’s Measure (or Jensen’s Alpha)
Michael Jensen’s measure, denoted by a, is also a risk adjusted measure. It is the actual return on the portfolio over and above the CAPM predicted return. It is measured as follows:
aj = Actual return-Expected Return under CAPM…………..(10.3)
It must be noted that the expected return from CAPM is calculated as under
E(Rp) = Rf + [RM-Rf]βp…………………………………………………….(10.3A)
It can be observed that Jensen’s alpha measures “abnormal return” of a portfolio. The higher the alpha, the better it is. The value of
alpha may be positive, zero or negative. When the portfolio provides a return higher than the expected return as per CAPM, the value of Jensen’s alpha is positive. When the portfolio provides a return exactly same as expected under CAPM, the value of Jensen’s alpha is zero. On the other hand, when the portfolio provides a return lower than the expected return as per CAPM, the value of Jensen’s alpha will be negative.
It must be noted that the Jensen’s alpha of the market portfolio is always zero. This is because the beta factor of the market portfolio is always 1. Therefore if we put beta of the portfolio as 1 in the equation of CAPM above we get the market return only. Hence actual market return is always same as expected market return and therefore Jensen’s alpha of the market portfolio is always zero.
Ranking of Portfolios
When we have to rank the portfolios we give first rank to the one having highest Jensen’s alpha and the last rank to the one having lowest Jensen’s alpha. Hence ranking of portfolios can be done in the descending order of Jensen’s alpha.
Whether Outperformed or Underperformed
Using Jensen’s alpha a portfolio outperforms if Jensen’s alpha is positive.
On the other hand if Jensen’s alpha is negative the portfolio is said to be an underperformer.
If Jensen’s alpha is zero, then the portfolio is performing as expected.
2.4 Treynor’s Ratio and Jensen’s Alpha
It must be noted that both the Treynor’s ratio and Jensen’s alpha uses systematic risk factor i.e. beta factor to evaluate the performance of the portfolio. Hence they always provide similar results in terms of ranking.
3. Mutual Funds
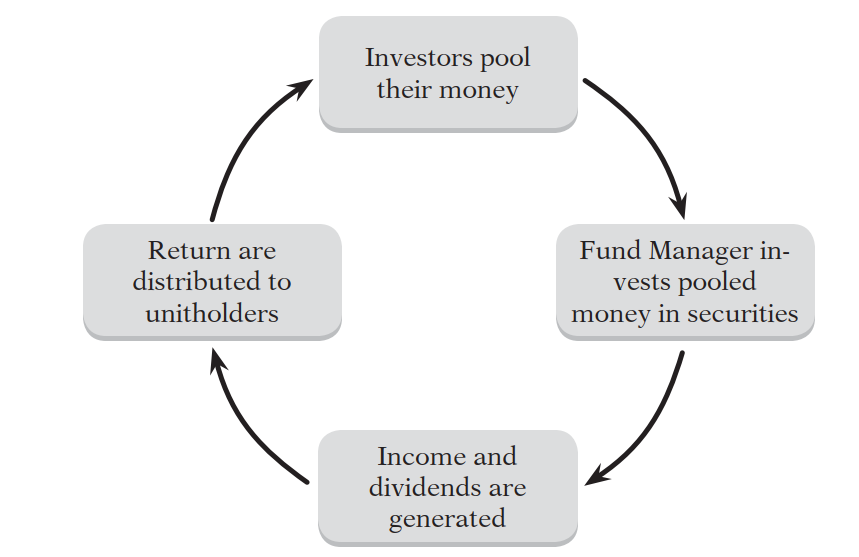
Mutual fund is a financial intermediary that collects funds from individual investors and invests those funds in a wide range of assets or securities. The individual investor has a claim to the portfolio established by the mutual fund in the proportion of the amount invested, thereby becoming a part owner of the assets of mutual funds. The fund employs professional experts and investment consultants who invest the money so collected in different stocks, bonds or other securities so as to meet the objective of fund. The net income earned on these investments together with the capital appreciation, if any, are shared with the unit holders in the proportion of units held by them. The mutual fund manager charges fee from the unit holders for administering the fund and managing the portfolio of investment. In India Mutual Funds are required to get registered with the Securities and Exchange Board of India (SEBI).
3.1 Mutual Funds Are An Indirect Mode of Investment
Mutual funds as explained above pools the money from investors and invest it across a wide range of securities. Hence from an investor’s point of view, mutual funds is an indirect mode of investment in financial and other assets and securities. Direct mode of investment is one in which an investor invests directly in securities or assets by himself purchasing them. In case of mutual funds, the investor invests in a particular scheme of a mutual fund and hence buys or invests in the units of mutual funds. The mutual fund in turn invests the amount given by the investor, in assets and securities and creates a portfolio. The value of this portfolio represents the value of the units sold by the mutual funds. To be precise, the net asset value (NAV) of the portfolio reflects the value of the unit held by the investor.
For example, Mr. X wants to invest Rs. 10000 in equity shares. He can do so using two modes in investment. (i) Direct investment – in this case Mr. X will first of all decide about the equity shares in which investment is to be made, then he will allocate Rs. 10000 among these equity shares and finally buy equity shares. He has to manage this portfolio of equity shares on his own and revise it periodically. (ii) Indirect Mode of Investment- in this case, Mr. X will buy the units of an Equity mutual fund scheme which invests in a diversified portfolio of equity shares. By buying the units of mutual fund, Mr X supplies his Rs. 10000 to the mutual fund which in turn invests it in equity shares. The task of shares selection, portfolio construction and revision is not done by Mr. X now. It is done by the fund manager, for which the mutual fund charges some nominal fee.
Hence Indirect mode of investment i.e. mutual funds represent a convenient mode of investment for a small investor who has small savings and does not possess requisite skills for investment.
4. Evolution of Mutual Funds in India
The mutual fund industry in India began in 1963 with the formation of Unit Trust of India, at the initiative of the Government of India and Reserve Bank of India. It can mainly be divided into four phases:-
4.1 First Phase – 1964-1987
Unit Trust of India (UTI) was established in 1963. UTI launched its first scheme named as Unit Scheme 1964. For a quite long period of time UTI was the only mutual fund operating India. UTI enjoyed monopoly till the year 1987.
4.2 Second Phase – 1987-1993
During this phase the Government allowed entry of public sector banks, Life Insurance Corporation of India (LIC) and General Insurance Corporation of India (GIC) into the mutual fund industry. SBI Mutual Fund established India’s first non-UTI Mutual Fund in 1987. The same year witnessed the entry of Canbank Mutual Fund. Other banks following the suit were Punjab National Bank Mutual Fund (1989), Indian Bank Mutual Fund (1989), Bank of India (1990), and Bank of Baroda Mutual Fund (1992). LIC and GIC established their mutual funds in 1989 and 1990 respectively.
4.3 Third Phase – 1993-2003
This phase marked the entry of private sector into mutual fund industry in India. Moreover, the phase witnessed the first Mutual Fund Regulations (1993), according to which all mutual funds, except UTI were needed to be registered. The first private sector mutual fund registered in 1993 was Kothari Pioneer which has now merged with Franklin Templeton. In the year 1996, market regulator SEBI came up with SEBI (Mutual Fund) Regulations 1996 replacing the old regulations of 1993. This phase had been a prosperous phase where number of mutual fund houses set up in India was on rise, with many foreign mutual funds setting up funds in India and also several mergers and acquisitions were witnessed by industry. In the year 1994 the first foreign mutual fund Morgan Stanley entered Indian Mutual fund industry.
4.4 Fourth Phase – Since February 2003
In this phase, UTI was divided into two separate entities. First is the Specified Undertaking of the UTI which functions under an administrator and the rules framed by Government of India and does not come under the purview of the Mutual Fund Regulations. Second is UTI Mutual Fund, sponsored by SBI, PNB, BOB and LIC, registered with SEBI and functions under the Mutual Fund Regulations. With tremendous growth potential as evident by mergers taking place among different private sector funds, the mutual fund industry can be said to have entered into its current phase of consolidation and growth.
Presently there are around 45 mutual fund organizations in India handling assets worth nearly Rs. 10 lakh crore. Today, the Indian mutual fund industry has opened up many exciting investment opportunities for investors. As a result, we have started witnessing the phenomenon of savings now being entrusted to the funds rather than in banks alone. Mutual Funds are now perhaps one of the most sought-after investment options for most investor.
Disclaimer: The content/information published on the website is only for general information of the user and shall not be construed as legal advice. While the Taxmann has exercised reasonable efforts to ensure the veracity of information/content published, Taxmann shall be under no liability in any manner whatsoever for incorrect information, if any.
Taxmann Publications has a dedicated in-house Research & Editorial Team. This team consists of a team of Chartered Accountants, Company Secretaries, and Lawyers. This team works under the guidance and supervision of editor-in-chief Mr Rakesh Bhargava.
The Research and Editorial Team is responsible for developing reliable and accurate content for the readers. The team follows the six-sigma approach to achieve the benchmark of zero error in its publications and research platforms. The team ensures that the following publication guidelines are thoroughly followed while developing the content:
- The statutory material is obtained only from the authorized and reliable sources
- All the latest developments in the judicial and legislative fields are covered
- Prepare the analytical write-ups on current, controversial, and important issues to help the readers to understand the concept and its implications
- Every content published by Taxmann is complete, accurate and lucid
- All evidence-based statements are supported with proper reference to Section, Circular No., Notification No. or citations
- The golden rules of grammar, style and consistency are thoroughly followed
- Font and size that’s easy to read and remain consistent across all imprint and digital publications are applied

