How to use Transfer Pricing Database for Benchmarking Analysis – Step-by-Step Guide | Best Practices
- Blog|Transfer Pricing|
- 26 Min Read
- By Taxmann
- |
- Last Updated on 16 July, 2024
Latest from Taxmann

A Transfer Pricing Database for Benchmarking Analysis is a comprehensive collection of financial and economic data used to determine arm's length prices for transactions between related entities within a multinational corporation. This database aids in transfer pricing compliance by providing benchmarks for evaluating whether the terms and conditions of intercompany transactions align with market conditions and regulatory standards.
CA. Mithilesh Reddy – Founder & CEO | Steadfast Business Consulting LLP (SBC)
Table of Contents
- Indian Transfer Pricing Landscape
- Transaction vs Profit – Based ALP Determination
- Benchmarking Analysis
- Preferred Transfer Pricing Database for Each Transaction Category
- Quantitative & Qualitative Criteria for Filters
- Prowess IQ Search Process
- Prowess IQ: Case Study
- Benchmarking 45 – Intragroup Loan
- Benchmarking – Intangibles
1. Indian Transfer Pricing Landscape
1.1 Why Transfer Pricing Regulations & the Objective of the Session
- The main objective of this session is to provide guidance on databases, as databases have not been specified by the OECD Manual or by Income Tax Authorities.
- In this session, we will discuss the preferred databases used in benchmarking analysis, considering those utilized by transfer pricing authorities, consultants, and Big Four firms, along with their sources and limitations.
Why Transfer Pricing Regulations?
- Preventing Tax Avoidance and Profit Shifting
- Aligning Taxation with Value Creation
- Protecting Tax Revenues of Jurisdictions
- Levelling the Playing Field for Businesses
- Enhancing Transparency and Compliance
- Ensuring Arm’s Length Transactions via Single Entity Approach for MNEs
1.2 Evolution of Transfer Pricing in India
- The Income-tax Act was introduced in 1961 adopting the erstwhile Act of 1922 wherein the laws of taxation of MNEs became significantly important soon after the globalization of the Indian Economy. India has never become part of the OECD; however, UN Model has already adopted the OECD Model of Transfer Pricing back in the 1980s.
- Following the UN Model in line with the OECD Model Transfer Pricing was introduced in India with effect from April 2001 under Sections 92 to 92F of the Income Tax Act, 1961 (“the Act”) which covers intra-group cross-border transactions.
- The sections became applicable from 1st April 2001 for cross border transactions and from 1st April 2012 for Specified Domestic transactions.
2001
Transfer Pricing was introduced in India with effect from April 2001 under Sections 92 to 92F of the Income Tax Act, 1961 (“Act’)
2012
- Domestic Transfer Pricing Regime (Specified Domestic Transactions)
- Advance Pricing Agreement Regime
- International Transaction has been expanded
2013
Safe Harbour Rules
2016
Framework for use of multiple year data and range concept in benchmarking analysis, three tier TP documentation structure as per BEPS (Base Erosion and Profit Shifting) Action Plan 13
2017
Secondary adjustment provisions and limiting interest deduction for thinly capitalized companies
1.3 Evolution of Transfer Pricing in UAE
Past
- Customs (Assessable Value/Market Valuation)
- VAT 2017 (Market Value for Related Party Transactions)
- ESR 2019 (Substance Test for Relevant Activities – Holding Cos, HQ, IP, Distribution & Service Centres, Banking, Insurance, Investment Fund Management & Shipping)
- Country-by-Country Report (BEPS Action Plan 13) 2019
-
- BEPS Action Plans (AP) Implementation
- AP 5 (Counter harmful tax practices)
- AP 6 (Preventing treaty abuse)
- AP 13 (TP documents, including CbCR)
- AP 14 (Make dispute resolution mechanisms more effective)
- AP 15 (Develop a multilateral instrument)
Present (2023-25)
- Corporate Tax & Transfer Pricing
- ALP test for Related Party & Connected Persons Payments
- Year-end TP compliances (Disclosure Form, Local File & Master File)
- Primary & Corresponding adjustments
- BEPS Action Plans Implementation
- AP 4 (Thin cap/interest deductions)
- AP 7 (Prevent artificial avoidance of PE)
-
-
- AP 8 (Align TP with value creation – Intangibles)
- AP 9 (Align TP with value creation – Risk and Capital)
- AP 10 (Align TP with value creation – high risk transactions)
-
Future
- UAE Transfer Pricing Rules
- APA/MAP framework
- Possible safe harbour rules
- TP audit/litigation mechanism
- Possible secondary adjustment provisions
- Transfer Pricing Technology – Tools & AI
- BEPS Pillar 2 (Global Minimum Tax Rules)
- BEPS Pillar 1 (Market/users Jurisdictions)
1.4 Associated Enterprise (AE) & Deemed AE – Sec 92A
Associated Enterprise as per Section 92A (1) of Income Tax Act, 1961
- For the purposes of this section and sections 92, 92B, 92C, 92D, 92E and 92F, “associated enterprise”, in relation to another enterprise, means an enterprise—
- which participates, directly or indirectly, or through one or more intermediaries, in the management or control or capital of the other enterprise; or
- in respect of which one or more persons who participate, directly or indirectly, or through one or more intermediaries, in its management or control or capital, are the same persons who participate, directly or indirectly, or through one or more intermediaries, in the management or control or capital of the other enterprise.
Deemed Associated Enterprise as per Section 92A (2) of Income Tax Act, 1961
Capital
1. >= 26% direct/indirect holding by enterprise
OR
2. By same person in each enterprise
3. Loan >= 51% of Total Assets
4. Guarantees > = 10% of debt
5. > 10% interest in Firm/AOP/BOI
Management
6. Appointment > 50% of Directors/one or more Executive Director by an enterprise
OR
7. Appointment by same person in each enterprise
Control
8. 100% dependence on use of intangibles for manufacture/processing/business
9. Direct/indirect supply of > = 90% Raw Materials under influenced prices and conditions
10. Sale under influenced prices and conditions
11. One enterprise controlled by an individual and the other by himself or his relative or jointly
12. One enterprise controlled by HUF and the other by
- a member of HUF
- his relative or
- Jointly by member and relative
1.5 International Transaction – Sec 92B
Transactions between two or more AEs, either or both of whom are non-residents
| Tangible Property | Intangible Property | Financing | Services | Business Restructuring | |
| Transactions Covered | Purchase/Sales of:
|
Both Licensing & Transfers of IP:
|
Debt financing
Capital transactions
|
|
Change in Supply Chain/Characterizations/Group shareholding Structure/Business Transfers & Combinations |
| Method |
|
|
|
|
|
| Database |
|
Royaltyrange, Royaltystat | Loan Connector |
|
Internal/Management/Industry data |
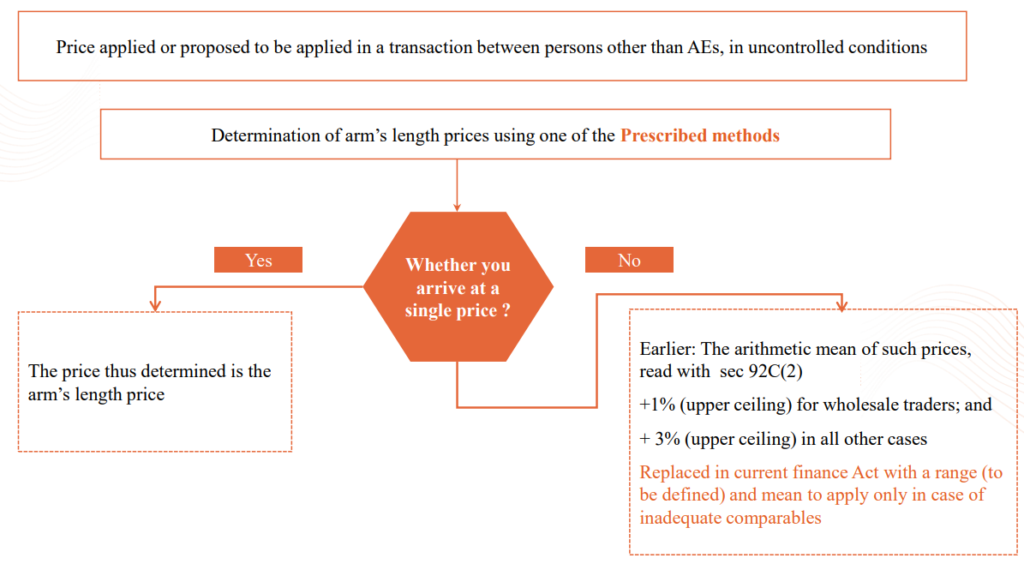
1.6 Arm’s Length Price – Sec 92C
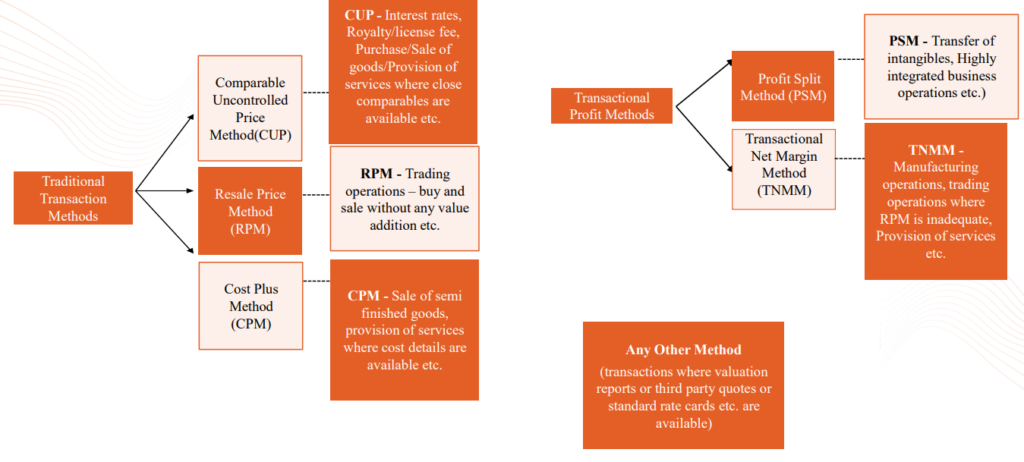
1.7 Transfer Pricing Methods – Rule 10B, Sec 92C
1.8 Illustrative Applicability of Different Methods
Some common nature of transactions and the most applicable methods is specified below:
| Nature of transactions | CUP Method | RPM | CPM | PSM | TNMM | Other Method |
| Manufacturing | ✔ | ✔ | ✔ | |||
| Distribution of goods | ✔ | ✔ | ||||
| Provision of services (IT, ITeS) | ✔ | |||||
| Financial transaction (interest on loan, corporate guarantee) | ✔ | ✔ | ||||
| Royalty Payment | ✔ | ✔ | ||||
| Highly Integrated and Unique Intangible transactions | ✔ | |||||
| Sale/purchase of commodities, shares, fixed assets (where value can be substantiated with valuation report, quotation etc.) | ✔ | |||||
| Specified Domestic Transaction – Inter-Unit Transfers | ✔ | ✔ |
1.9 Profit Level indicator (PLI)
- Profit Level Indicators (PLIs) are financial ratios that measure the relationship between profits and costs incurred or resources employed.
- The use of an appropriate PLI ensures better accuracy in the determination of the arm’s length price of a related party transaction.
- The Resale Price Method (RPM), Cost Plus Method (CPM) and Transactional Net Margin Method (TNMM) are the transfer pricing methods that use PLI to determine whether the related party transaction involved is carried out at arm’s length.
Factors to consider include but are not limited to in determining the PLI:
- characterization of business;
- availability of comparable data; and
- the extent to which the PLI is likely to produce a reliable measure of arm’s length profit.
Generally used PLIs
| TP Method | PLI | Formula |
| RPM | Gross margin | GP/Sales |
| CPM | Gross cost-plus margin | GP/ direct & indirect cost of production |
| TNMM | Cost plus Markup | Operating Profit/Operating Cost |
| TNMM | Net profit margin | Operating Profit/Operating Revenue |
| TNMM | Berry ratio | Operating Profit/Value Addition |
| TNMM | Cash PLI | Operating profit/PBDIT |
1.10 Operating Items vs Non – Operating Items
- For the purpose of transfer pricing margin computation, it is important to only consider those items of income/expense which are directly related to core operations of the company
- Operating items: Those relating to the day-to-day operations of the enterprise, being incurred in the normal course of business and related to the principle revenue generating activities.
- Non-operating items: Includes investing and financing activities which are not related to principle revenue generating activities.
Operating Items
- Foreign Exchange Gains/Losses
- Sale of scrap
- Provisions/liabilities/balances no longer required written back
- Commission received
- Interest from customers on delayed payment
- Miscellaneous Income
- Deferred/Amortised Expenditure
- Bank Charges
- Business development expense
- Commission paid
- Rent paid
Non-operating items
- Payment or receipt of Interest/Dividend
- Rent Received
- Write-back of provision for diminution in the value of investments/impairment of assets
- Profit or Loss on sale of Assets/Investments/Assets written-off
- Finance charges
- Prior period expense
- Donations/CSR expenses
- Loss on fire/natural calamities/thefts etc.
- Preliminary and pre-operating cost
- Provision for doubtful debts or other contingent provisions
- Extra-ordinary incomes or expenses
1.11 Range Concept and Multiple year Data – Rule 10CA, Notification No. 83/2015
Evolution over years
Data
- Before 2014 – Single year Data
- After 2014 – Multiple year data up to preceding 2 years
Tolerance
- Finance Act 2011: +/- 5% on Transfer Price
- Finance Act 2012: +/- 1% for wholesalers +/- 3% for others On TransferPrice
Range Transactions before 01-04-2014
- Arithmetic Mean with benefit of Tolerance Range
- Arithmetic Mean: If the *conditions are not satisfied
Range Transactions after 01-04-2014
- 35th & 65th Percentile: if Transaction price is within the range if 6 or more comparables are present
- TP Adjustment to be calculated on Median: If transaction price falls outside the range
Applicability to Methods
| Method | Multiple year Data | Range |
| TNMM | ✔ | ✔ |
| CUP | ✘ | ✔ |
| RPM | ✔ | ✔ |
| PSM | ✘ | ✘ |
| CPM | ✔ | ✔ |
| Other Method | ✘ | ✘ |
International Practices
- Range – Inter-Quartile range: 25th & 75th Percentiles
- All methods are applicable for Range and Multiple Year data concept
- No minimum comparables required for Range Concept
Applicability of Range concept
As per Rule 10CA, the ‘range concept’ shall be applicable when:
- the MAM is either CUP, RPM, CPM, or TNMM; and
- there are at least 6 comparables.
1.12 Arms Length Price – Range Sec 92 (C2)
- “Range” concept followed internationally; also propounded by OECD
- Use of inter-quartile range is amongst the globally accepted best practice and also closer to economic realities wherein prices, and or margins, are compared to those within a range and not at to a particular point.
- India has adopted percentile concept instead of inter-quartile range
- Arithmetic mean concept is also used where number of comparable is inadequate
| Method | Multiple year Data | Range |
| TNMM | ✔ | ✔ |
| CUP | ✘ | ✔ |
| RPM | ✔ | ✔ |
| PSM | ✘ | ✘ |
| CPM | ✔ | ✔ |
| Other Method | ✘ | ✘ |
2. Transaction vs Profit – Based ALP Determination
2.1 Transaction v/s Profit based Arm’s Length Price determination
| Relevant Aspect of TP | Evaluation Criteria | |
| Transaction-Based | Profit-Based | |
| Methods | CUP Method, Resale Price Method, Cost Plus Method | TNMM, Profit Split Method |
| Profit Measure | Gross Profits (CUP uses Sales, Purchases) | Net Profits |
| Functional Comparability | PSM, RSM – High
CUP – very high |
Medium |
| Product Comparability | High | PSM – High TNMM – More tolerant |
| Application | PSM, RSM – Difficult to apply as high degree of comparability required
CUP – Very difficult to apply as very high degree of comparability required |
PSM – Complex method, sparingly used
TNMM – Most commonly used method |
3. Benchmarking Analysis
3.1 Contents of Local File – Sec 92D, Rule 10D
- Local File
- Master File
- CountryCountry (CbC) Report
Structure of TP Documentation
- Executive Summary
- Group Overview
- Industry Overview
- Functional Analysis
- Selection of tested party
- Selection of most appropriate method
- Economic analysis
- Conclusion
3.2 Overview of TP Benchmarking Analysis
Transaction Analysis
- Activity – Services/Manufacturing/Trading
- Scope of Activities
- Transaction Flow – Domestic/International
- Entities Involved
- Segment/Industry
- Remuneration Mechanism/TP Model
- Existing Price/Margin
FAR with Supply Chain Analysis
- Functions Performed
- Assets Employed
- Risks Borne
Characterisation of Entities
- Full-fledged or Contract Manufacturer
- Full-fledged or Limited Risk Distributor
- High-End or Low-End Services Provider
Economic Analysis
- Selection of TP Method (CUP/RPM/CPM/PSM/TNMM/Other Method)
- Selection of Tested Party (Indian Taxpayer or Foreign AE)
- Selection of Profit Level Indicator (PLI)
- Selection of TP database
- Comparability Analysis
- Arm’s Length Range
3.3 Why Benchmarking?
- Tax Compliance Requirement: Companies are obligated to comply with the relevant TP regulations in the country (Ex: In India Sec 92 and Rule 10, in UAE Article 34) which necessitates that transactions with Related Parties meet the arm’s length standard for determining taxable income.
- Arm’s Length Standard: This standard implies that transactions should produce results consistent with what unrelated parties would achieve in similar circumstances/same industry in open market.
- Transfer Pricing Methods: To determine arm’s length prices, companies utilize various transfer pricing methods, such as CUP, RPM, CPM, TNMM, and PSM.
- External Comparable Data: Methods such as CUP, RPM, CPM, and TNMM rely on external data to establish comparable pricing. Even in cases where internal comparable data is present, tax authorities may consider it unreliable or tailored specifically for transfer pricing compliance. Thus, it is imperative to conduct an external industry benchmark for transfer pricing planning and compliance.
- Data Sources: To find potential comparables, companies explore various sources, including TP databases, internal data, and other publicly available information.
- TP Databases: TP databases (TP Catalyst, S&P Capital IQ, RoyaltyStat & Loan Connector) compile publicly available company data in an accessible format, making them a practical and cost effective source of external comparables.
- Geographic Expansion: Normally, the relevant jurisdiction will be considered based on the Service provider, Place of supply or Service Recipient. Depending on the tested party the jurisdiction of search would be relevant. For example, in cases where financial data in a particular region, such as the UAE, is limited, companies may need to broaden their search to regions like Middle East, Africa and Eastern Europe. Multi-jurisdictional data has to be used in case regional companies are not available
- Lack of Authorized Databases: It is worth noting that there is no government database containing such financial information. Based on our experience, none of the mature transfer pricing jurisdictions publish similar financial information for transfer pricing in the public domain.
- The only realistic option available to the taxpayer for finding comparables is to rely on a financial database to obtain financial information for companies operating in the Middle East, Africa, and Eastern Europe across a spectrum of industries.
3.4 Step wise approach for TP Benchmarking
1. Select most appropriate TP method: There are two Types of Methods:
- Traditional Transaction Methods:
-
- Comparable Uncontrolled Price (CUP)
- Resale Price Method (RPM)
- Cost Plus Method (CPM)
- Transactional Profit Methods:
-
- Profit Split Method (PSM)
- Transactional Net Margin Method (TNMM)
2. Select Tested Party: The entity to be selected as the “tested party” should be the least complex and not necessarily unique.
3. Select Profit Level Indicator: Selecting the right PLI depends on the transaction’s specifics, including:
- business type;
- comparable data; and
- PLI reliability in measuring arm’s length profit.
4. Select publicly available database: Databases such as CapitaLine, AceTP, Prowess, Capital IQ, Bloomberg, Tracxn, RoyaltyStat, RoyaltyRange, etc can be utilized to access relevant data.
5. Industry classification and key words: Select industry classification and key words pertaining to the entity under consideration.
6. Quantitative Analysis: Apply filters/screens such as:
- data availability,
- Sales>1 Cr,
- Positive net worth,
- Core services income > 75%,
- Export earnings > 75%,
- RPT transactions < 25% etc.
7. Qualitative analysis: Download the annual report and review business description, service or product profile, segmental info, extraordinary events, IP holdings etc.
8. Final Set of Comparable Companies: Finalize the set of comparable companies. If there are more than 6, compute the 3-year weighted average mark-up and use the 35th to 65th percentile range. Otherwise, use the average mark-up.
9. Economic Adjustments: If there are any differences in comparables and test party, adjust those differences undertaking economic adjustments

4. Preferred Transfer Pricing Database for Each Transaction Category
4.1 Indian & Global TP databases – Transaction & Region wise
There are no specific public databases recommended for identifying comparable companies as per the United Nations Transfer Pricing (UN TP) guide, the Organisation for Economic Co-operation and Development (OECD) Guidelines, and the Income Tax Act. Following are the preferred databases:
| Transaction | Database | Provider | Content | Region |
| Manufacturing, Trading, Services | Capitaline TP | Capital Market Publishers India | Company financial information (Private & Listed Companies) | India |
| Prowess | Centre for Monitoring Indian Economy | |||
| Ace TP | Accord Fintech | |||
| TP Catalyst | Bureau Van Dijk | Global | ||
| Capital IQ – Financials | S&P | |||
| Interest transactions | Bloomberg | Bloomberg Reference Data Services | Financial markets data | Global |
| Dealscan/Loan Connector | Reffinitiv//Thomson Reuters (Worldwide) | Financial transactions data (loans) | Global | |
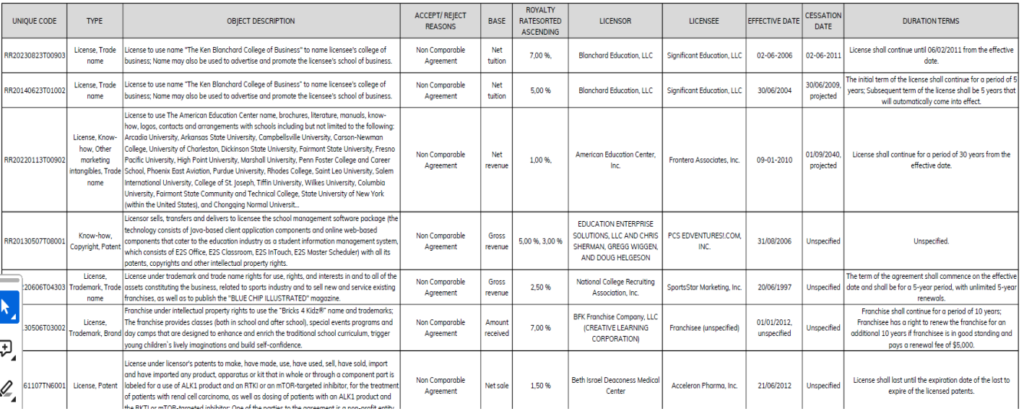
| Royalty, Intangible assets | RoyaltyStat | License Agreement Database | Intangibles License Agreements (Sourced from US SEC) | Global |
| Royaltysource | RoyaltySource | |||
| Royaltyrange | Royaltyrange |
4.2 TP Database – Source
Public Company Financials
- Data Extracted from Annual Reports
- Information from mandatory filings like 10-K and 20-F, for listed companies.
Inter-Company Agreements
- Intercompany agreements serve as a valuable source of TP data, detailing the terms and conditions of transactions between related entities.
- These agreements provide essential information for establishing arm’s length nature of transaction, they also outline roles, responsibilities, risks and rewards for accurate analysis
Industry Reports
- Reports from industry analysts and market research firms provide valuable insights.
- Industry-specific studies provide comparative data on margins, royalties, and other pricing metrics.
Private Company Financials
- Using private company financials as a source offers more accurate and relevant comparables for benchmarking analysis, as private companies often operate in specific markets or industries similar to the tested party.
- However, limited access to reliable and comprehensive financial data for private companies can challenge thorough and accurate analysis compared to public companies.
4.3 Database – Limitations
Data Quality:
- Financial data from public sources can vary in detail and accuracy
- Databases may not be updated in real-time
Timing Issues:
- Financial data is often available only after a significant delay
- Using historical financials may not reflect current market conditions
Veracity of Information:
- Public companies are required to disclose more detailed information compared to private companies, leading to potential biases in available data
- Errors in data collection, reporting, or entry can affect the reliability of the databases
Geographical Coverage:
- Some databases have better coverage in specific regions, which may not be representative of the global market
- Differences in tax laws and accounting standards across jurisdictions can complicate the comparability of data
Industry Representation
- Certain industries may be underrepresented in databases, making it challenging to find comparable data
- Companies with unique or innovative business models may not find adequate comparables in existing databases
5. Quantitative & Qualitative Criteria for Filters
5.1 Quantitative Analysis
Application of quantitative filter
Commonly used quantitative filters are:
- Availability of financial data
- Different FY Ending
- Turnover filter
- Net worth filter
- Consistently loss-making companies
- Export filter
- Employee Cost filter
- Related party transactions filter
Application of Specific filters
Commonly used qualitative filters are:
- Employee cost filter
- Service income/operating income filter
- Manufacturing income Filter
5.2 Quantitative and Qualitative Analysis
- Directors Report
- Notes to Accounts
- Auditor’s Reports
- Management Discussion
- Annual Reports
Available in:
- Capitaline
- ISI Emerging Markets
- ACE Equity
- MCA Website
- ProwessIQ
Application of qualitative filters
Commonly used qualitative filters are:
- Product/Service Profile
- Segments
- Presence of IP/Brand
- R&D functions
- Fluctuating/Abnormal Profits
- Extra-ordinary events/circumstances
- Government Companies
- Exceptional year of operations
6. Prowess IQ Search Process
6.1 Prowess – Summary of Search Steps
| Steps | Particulars |
| 1. | Selection of Comparables Companies |
| 2. | Adding Company Address and Identity Indicators to the Companies in current OSC |
| 3. | Adding Financial Information to the Companies in current OSC |
| 4. | Extraction of Related Party Transactions |
| 5. | Accept Reject Matrix – Applying all Quantitative and Qualitative filters to arrive at the final list of comparables. |
| 6. | Summary of final list of comparables |
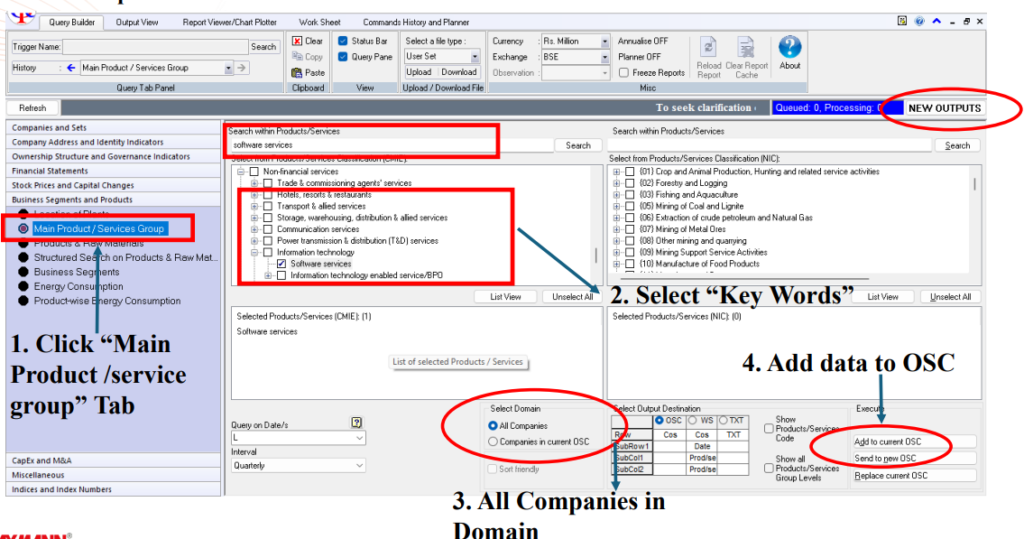
Prowess – 1. Selection of Comparable Companies
Step 1
- Login to Prowess with User ID and Password.
- From the left dialog box select “Business segment and products” tab.
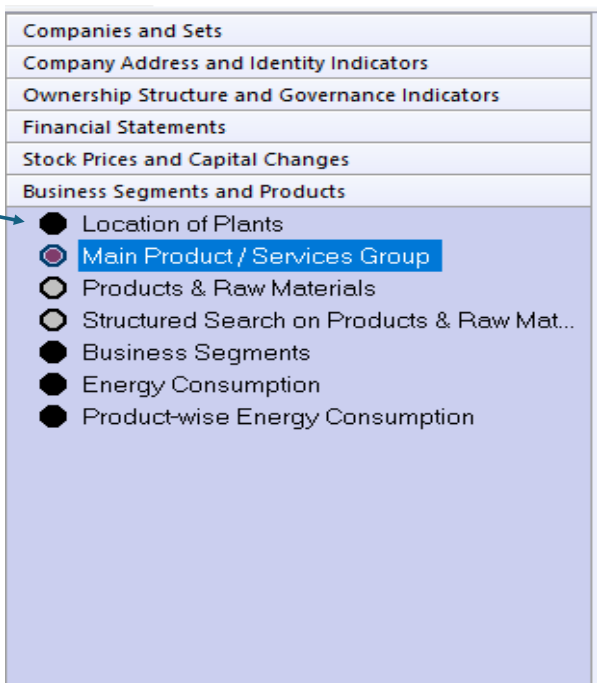
Step 2: After selecting main product/service group, relevant keywords may be selected by entering the relevant words in the search box. The Keywords selected will then be reflected in the dialog box below as Selected Product/Services.
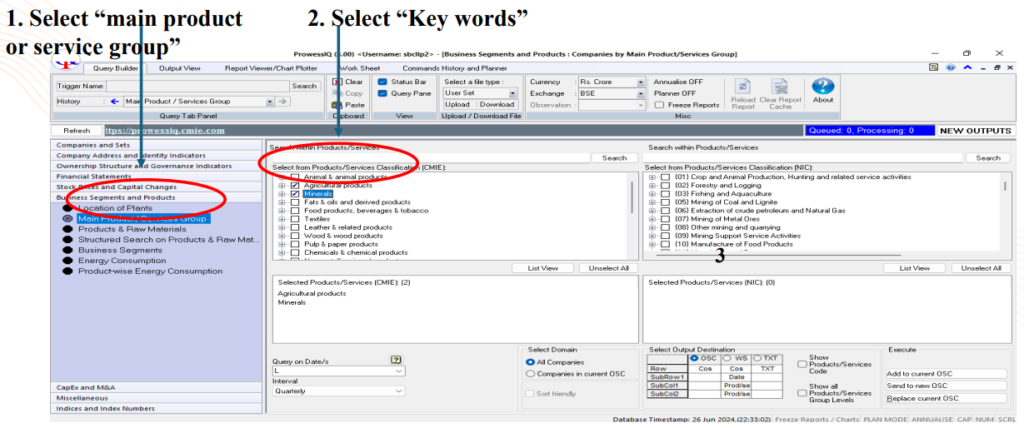
Step 3: Once all the relevant keywords are selected,
- Under “Select domain”: select “All companies”
- Under “execute” in the bottom right corner, click “send to new OSC”
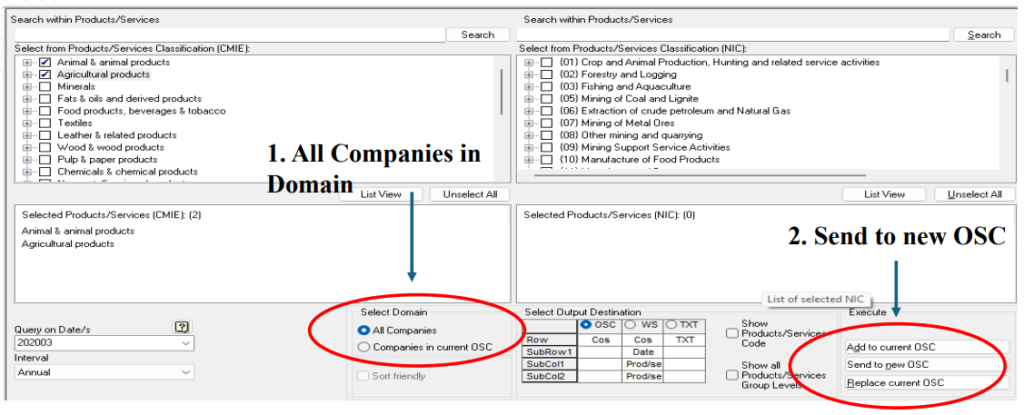
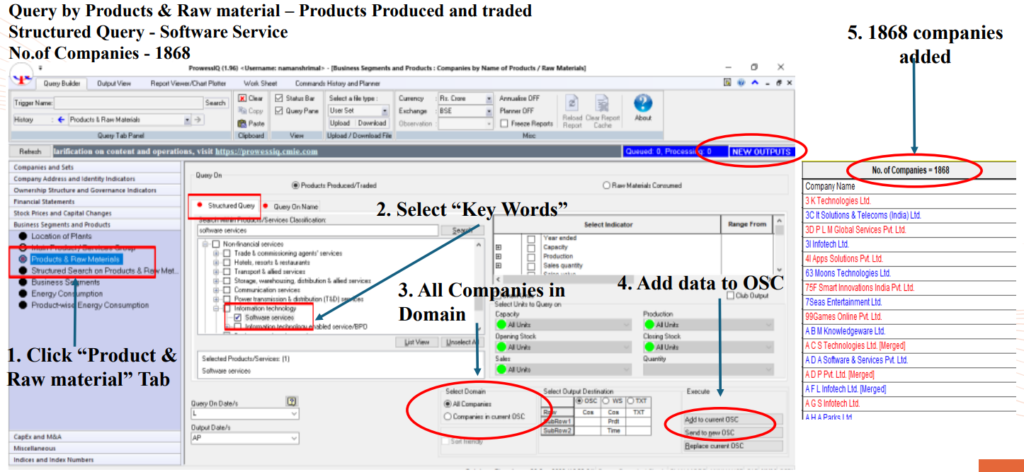
Note: In case keywords are being selected from tabs “Products & raw materials, Structured search on products & raw materials” after selecting from “main products/services group”, the same shall be “added to current OSC” rather than “sending it to new OSC”.
Step 4: After the Companies get triggered we will be able to see a tab “NEW OUTPUTS” blinking in blue colour on the top right corner. Click on the same and a new dialogue box appears. Press “Continue” and the relevant companies will be listed in the output view
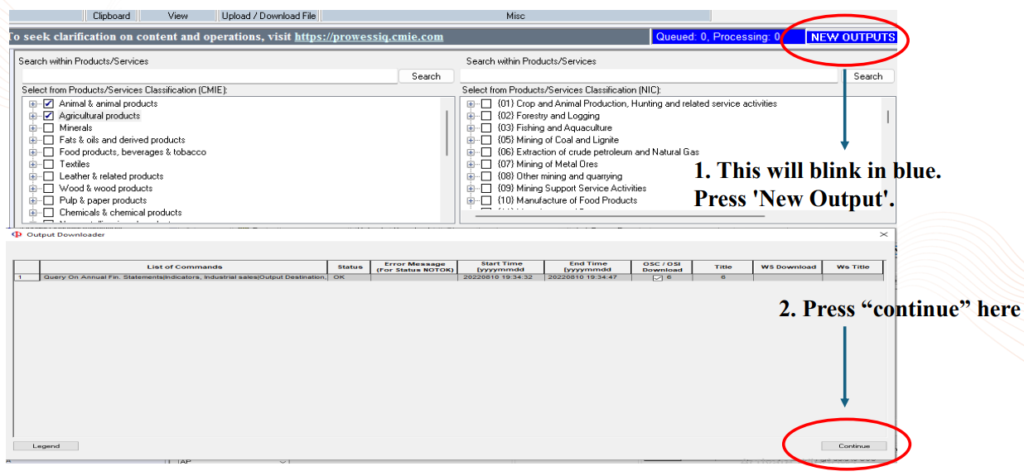
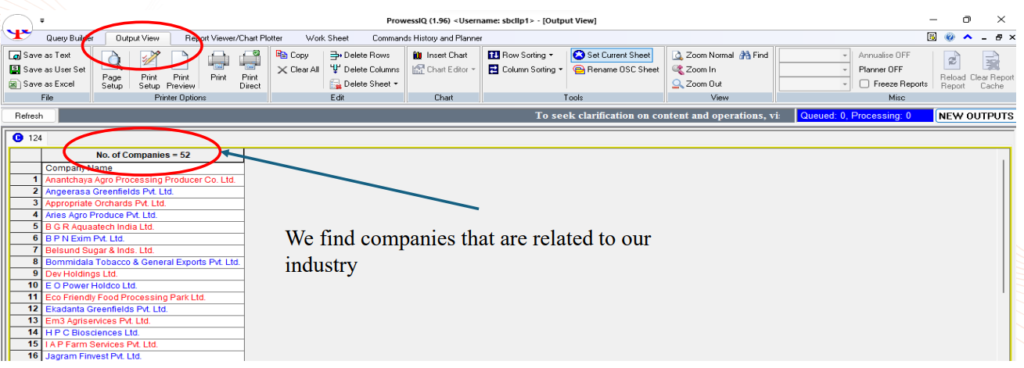
You will be automatically taken to the “Output View” containing the list of companies triggered with the search criteria selected previously.
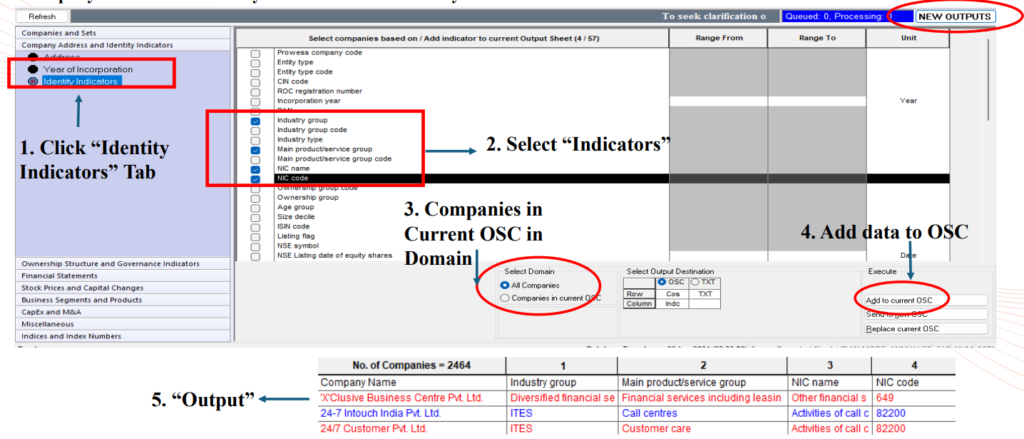
Prowess – 2. Company Address and Identity Indicators
Step 1: Select “Company Address and Identity Indicators” tab from the left dialog box
Step 2: Select NIC Code, NIC name, Industry Type, Main Product/ Service Group and any other fields from the right adjacent dialog box
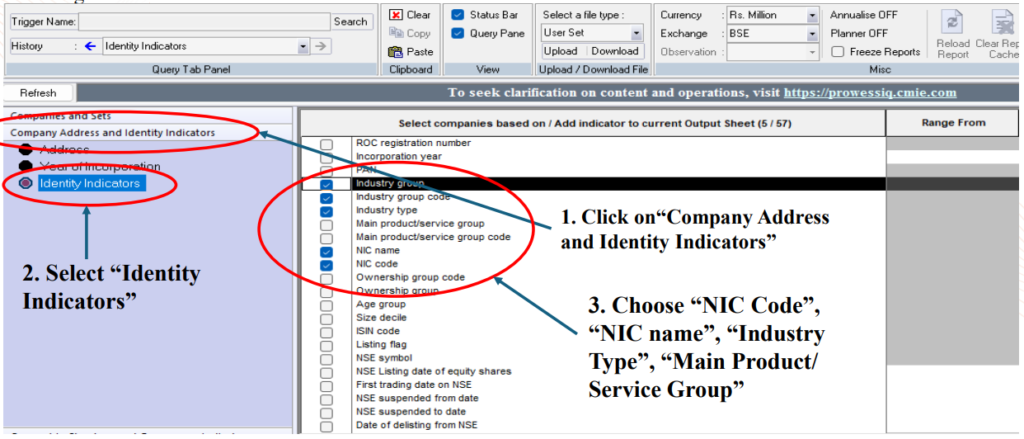
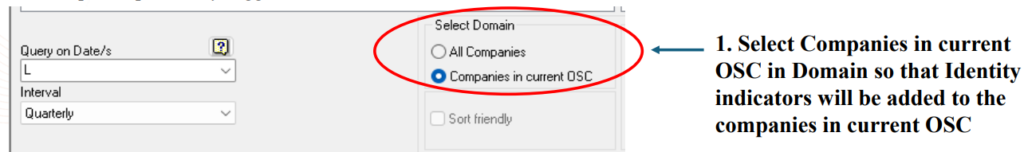
Step 3: After selecting the required data choose “Companies in current OSC” for extracting the selected identity indicators for the companies previously triggered.
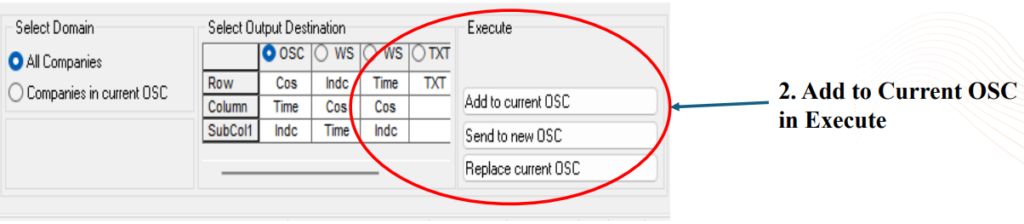
Step 4: Send the data to current OSC from the dialog box at the right corner. The identity indicators would be added to the companies existing in the output view.
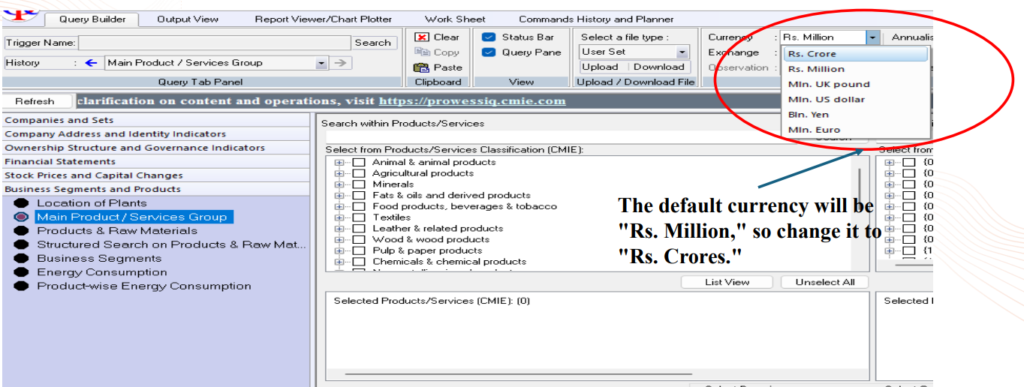
Change of currency: Before extracting the financial information for the companies in output sheet, change the currency from “Rs. Million” to “Rs. Crore”.
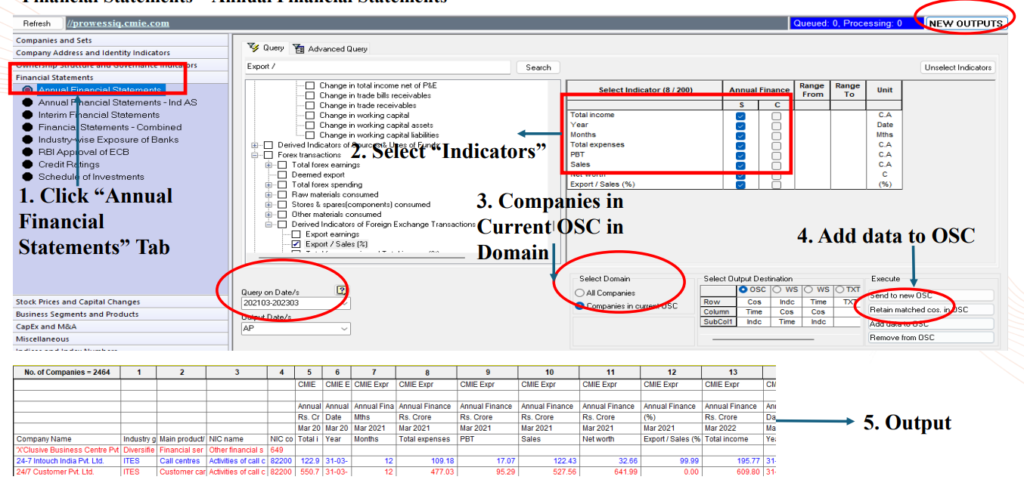
Prowess – 3. Financial Information
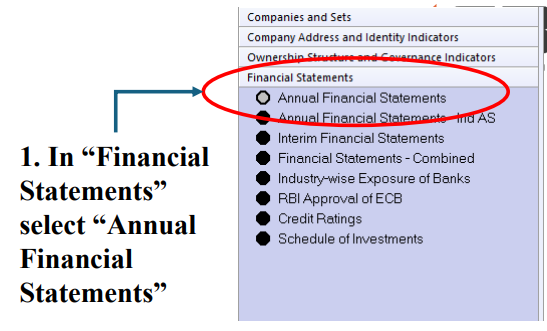
Step 1: Select “Financial Statements” tab from the left dialog box
Step 2: Select “Annual Financial Statements” from the drop down available below
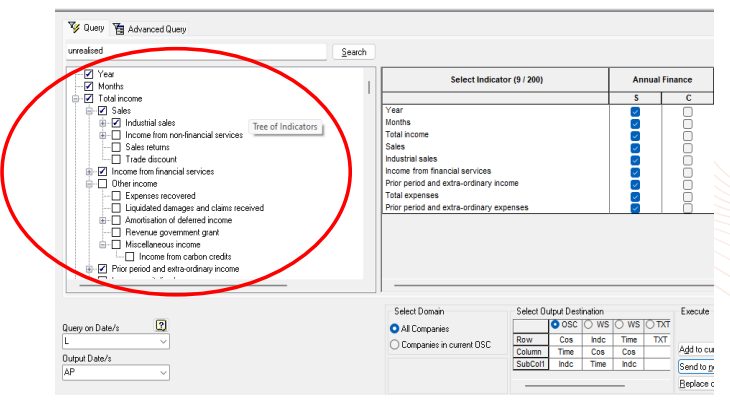
Step 3: Select the required Annual Information for applying filters from the adjacent dialog box using search box such as :
- Year
- Months
- Total Income
- Sales
- Industrial sales
- Income from non-financial services
- Trading Income
- Rent/Operating lease rent income
- Total Expenses
- Provisions
- Prior period and extra-ordinary expenses
- Provision for direct tax
- Donations
- Penalties on direct taxes
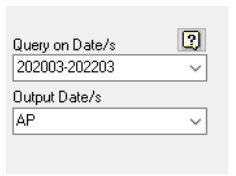
Step 4: Select Query on date for the period for which the data is required for the triggered companies in the format YYYYMM – YYYYMM
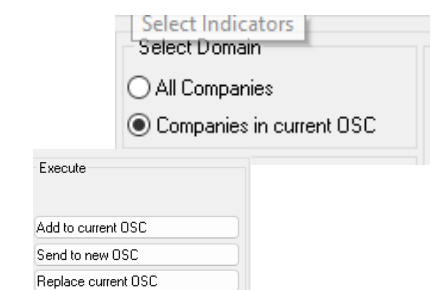
Step 5: Click “companies in current OSC” to extract financial data for the relevant period for the companies already triggered in the output sheet
Step 6: Add data to OSC and continue
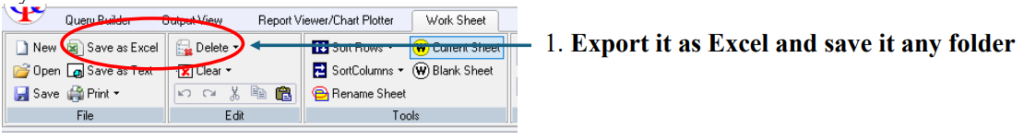
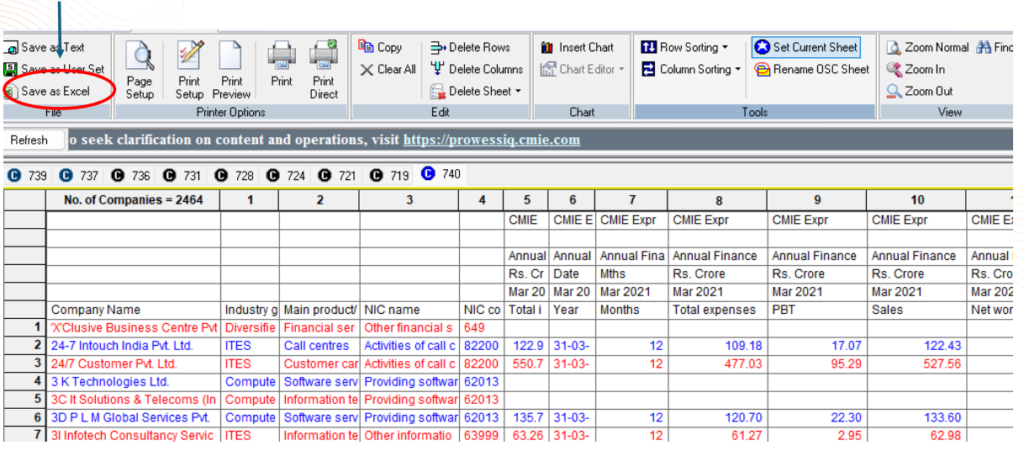
Step 7: Open “Output view” Tab and select “Save as Excel” from the left corner tab to save and extract the output as Excel.
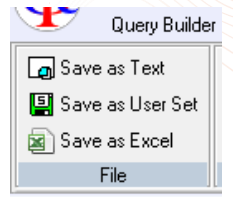
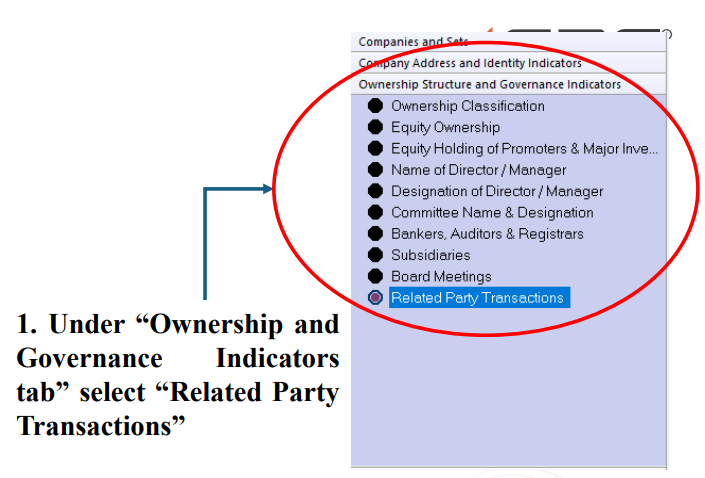
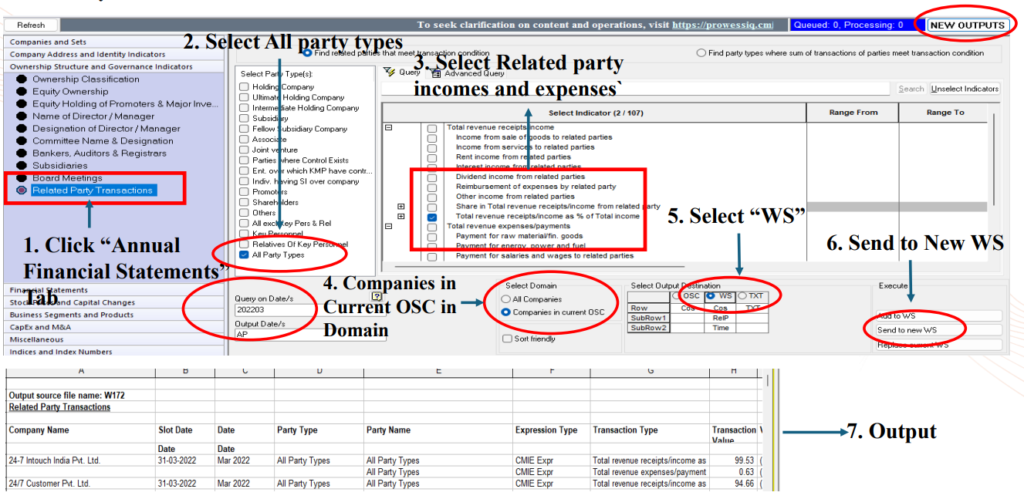
Prowess – 4. Related Party Transactions
Step 8: Under “Ownership and Governance Indicators tab” from the left dialog box select “Related Party Transactions” from the drop down available below
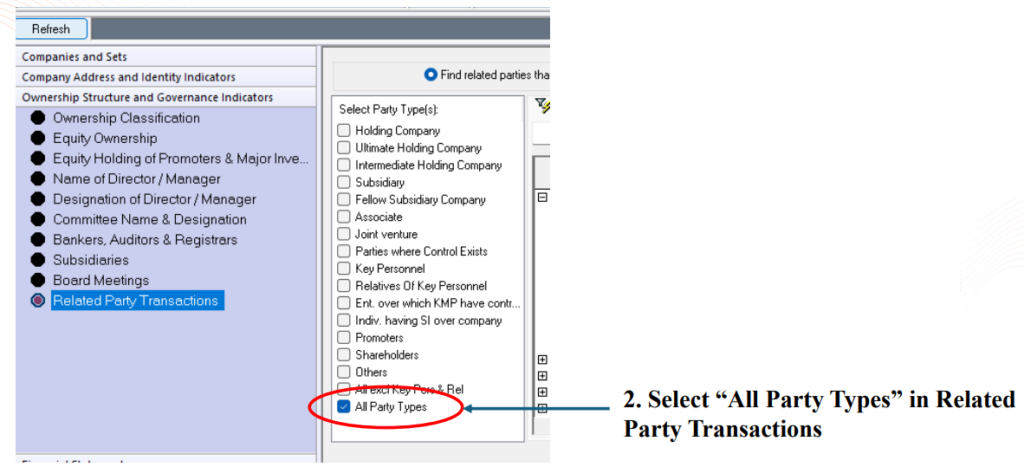
Step 9: From the “Select Party Type(s)” dialog box select “All Party Types”
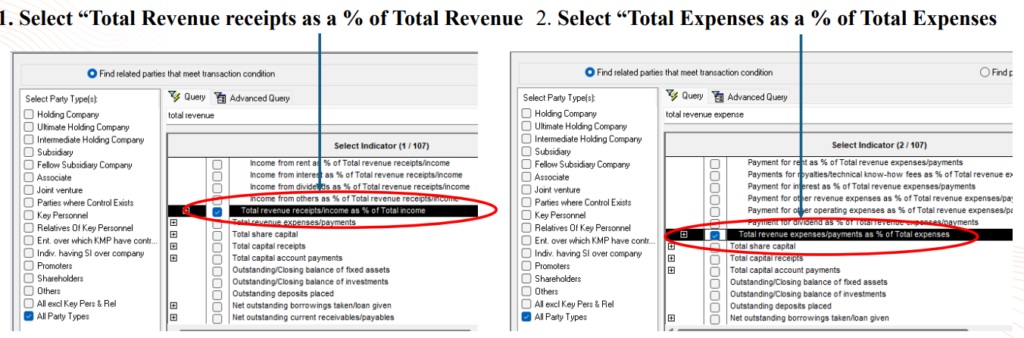
Step 10: Select “Total revenue receipts/income as a % of Total income” and “Total revenue expenses/payments as a % of Total Expenses” from the adjacent dialog box.
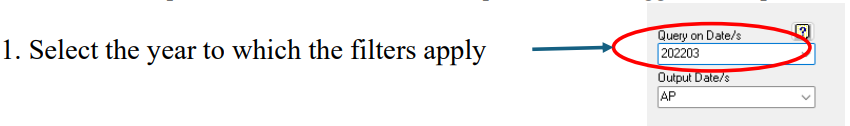
Step 12: Select Query on date as for the period for which the data is required for the triggered companies in the format YYYYMM
Step 13: Further select Companies in current OSC from the dialog box at the right corner to extract the Related Party Transactions for the relevant period for the companies already triggered in the output
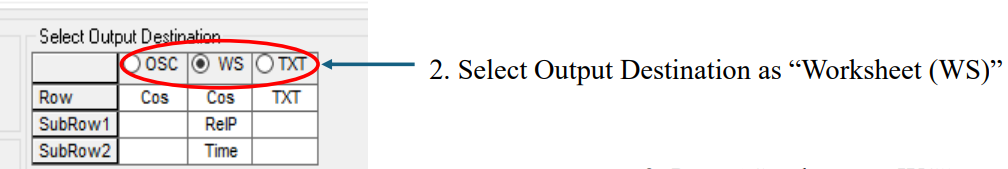
Step 14: Further select Output destination as WS tab from the dialog box adjacent to Select Domain
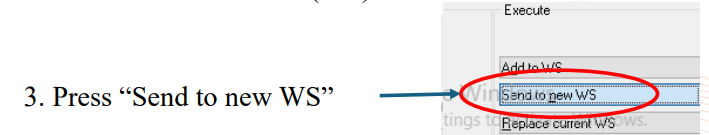
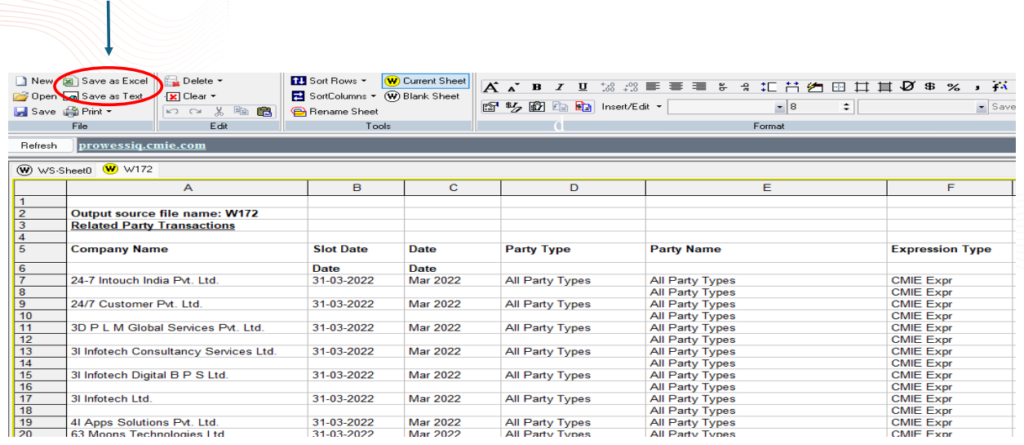
Step 15: Select Send to new WS tab to extract related party data into new work sheet. The data will be triggered after some time
![]()
Step 16: After the Data is triggered the “NEW OUTPUTS” on the right end blinks. Further click on the same and a new dialogue box appears. Press “Continue” and the relevant Related party data will be triggered in the Worksheet.
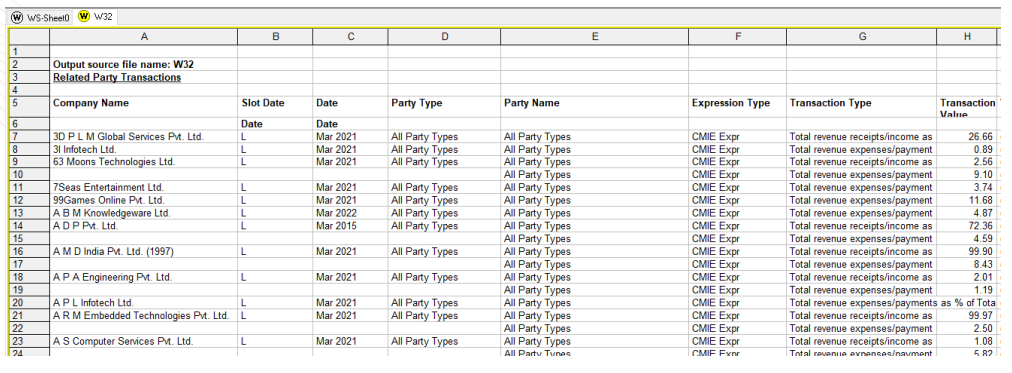
Step 17: We can anytime view data from the “Worksheet Tab” and export it as Excel and save it with the relevant name in any folder.
7. Prowess IQ: Case Study
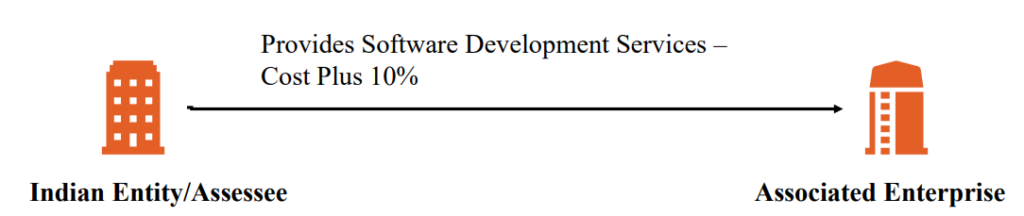
7.1 Prowess Case Study – Example
| Facts |
|
| Transaction | Provision of Software Development Services |
| Tested Party | Assessee Company |
| Selection of Method | CUP: No Internal Cup, External CUP data unavailable RPM: Not a reseller Gross Margin of comparable unavailable CPM: Gross Margin data of comparables unavailable PSM: No intangibles involved TNMM: Selected in absence of any other preferred method Any other method: Since TNMM is selected |
7.2 Prowess Case Study – Query
Select Companies in Pre-defined Sets
Computer Software
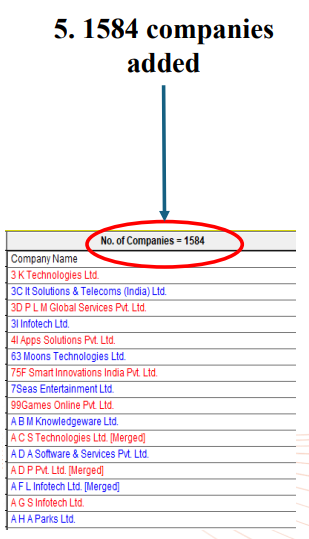
No.of Companies Added: 1584
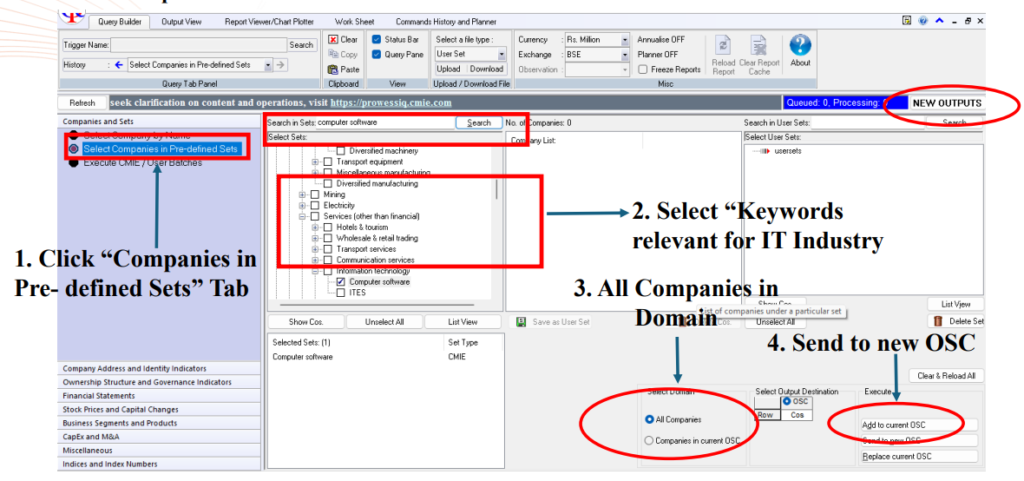
Main Product/Services Group of Company
Software Service
No.of Companies: 1584
Query by Products & Raw material – Products Produced and traded
Structured Query – Software Service
No.of Companies – 1868
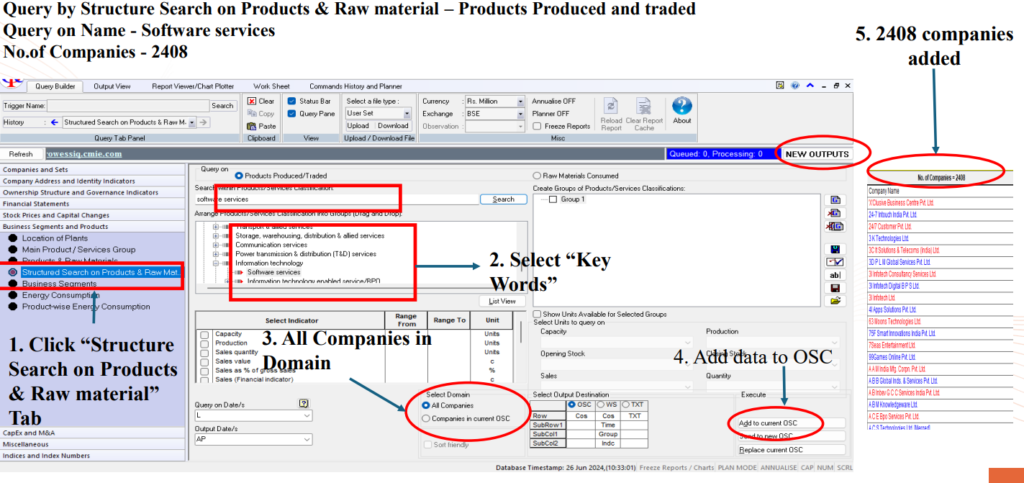
Query by Structure Search on Products & Raw material – Products Produced and traded
Query on Name – Software services
No.of Companies – 2408
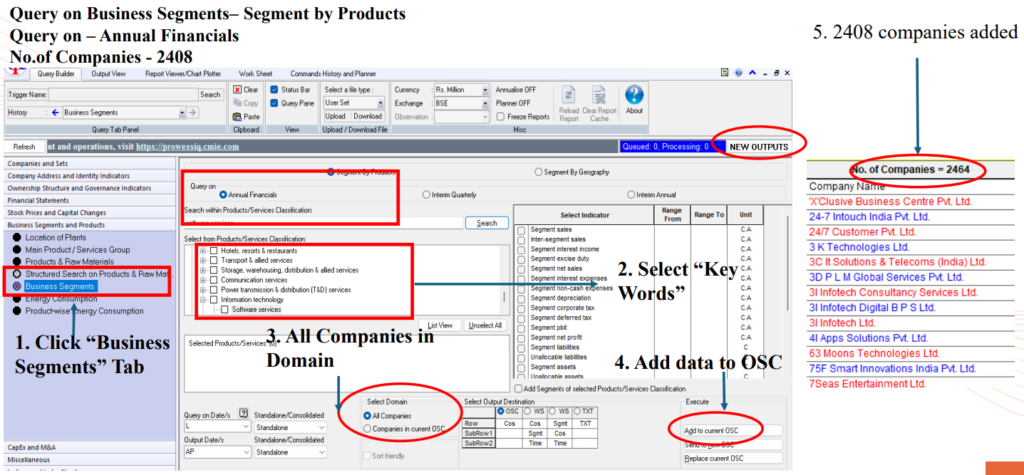
Query on Business Segments – Segment by Products
Query on – Annual Financials
No.of Companies – 2408
7.3 Prowess Case Study – Identity Indicators Extract
Company Address and Identity Indicators – Add Identity Indicators
7.4 Prowess Case Study – Financial Information Extract
Financial Statements – Annual Financial Statements
7.5 Prowess Case Study – Export/Copy/Save data
The final data can then be exported/copied to excel worksheet for quantitative analysis.
The final comparable data can be saved as a “user set” for future use and reference.
1. Export it as Excel and save it any folder
The final data can then be exported/copied to excel worksheet for quantitative analysis.
2. Export it as Excel and save it any folder
7.6 Prowess Case Study – Related Party Transactions Extract
Related Party Transactions – Find related Parties that meet transaction condition
7.7 Keywords Specific to IT Industry
Following Keywords have been used to arrive at the Comparables specific to Software Development Services.
Prowess IQ (a database compiled and managed by Centre for Monitoring Indian Economy Private Limited)
A search query on Prowess updated until 4th October, 2023 using the following keywords in the ‘Query by Business Segments and Products’ module:
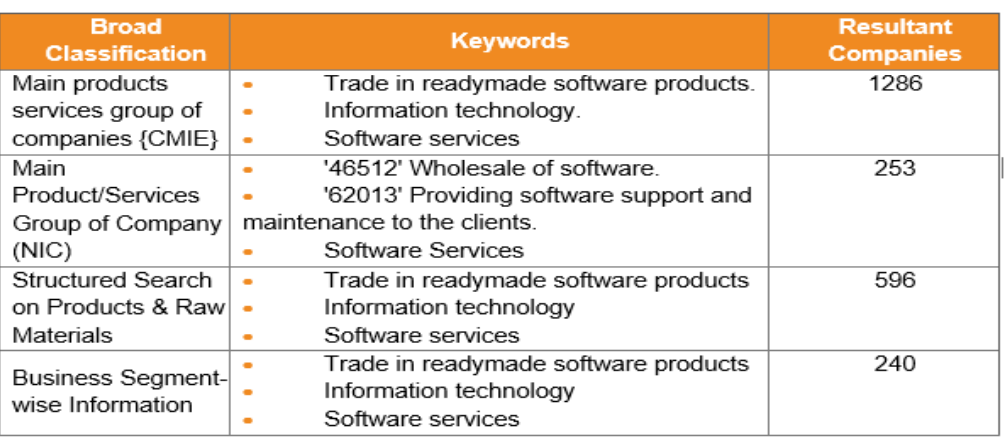
7.8 Search Criteria
The following qualitative and quantitative filters have been applied to the master data obtained from the Prowess search to arrive at the final list of comparables similar to the tested party.
7.9 Summarizing Business Descriptions
For the final list of comparables, we need to summarize the business descriptions from financial statements, media sources, the company’s website, and intercompany agreements or any other Internal data.
Below is an illustrative example for your reference.
Brief Business Description of the Comparable Companies – SWD Service Segment
- Sybrant Technologies Pvt. Ltd.: Sybrant Technologies Private Limited is an acclaimed software development company that provides Software development services, Data services, Platform Based Services, and other Real Estate services.
- Harbinger Systems Pvt. Ltd.: Harbinger Systems is a private company providing software technology services for independent software vendors and enterprises. Harbinger Systems builds software solutions leveraging digital technologies for domains such as HRTech, Healthtech, and Learning Tech.
- Wipro Ltd.: Wipro Limited specializes in IT and computer related technologies. The Group’s services encompass a number of areas, including software architecture, business intelligence systems, e-commerce, data warehousing, Internet access devices, network management, system administration, messaging systems, IT consulting and design. Wipro also has a presence in niche markets of consumer products.
- Athena Global Technologies Ltd.: Athena Global Technologies Limited provides information technology services. The Company offers software application development, infrastructure management, product engineering, e- commerce web, digital transformation, and consulting services.
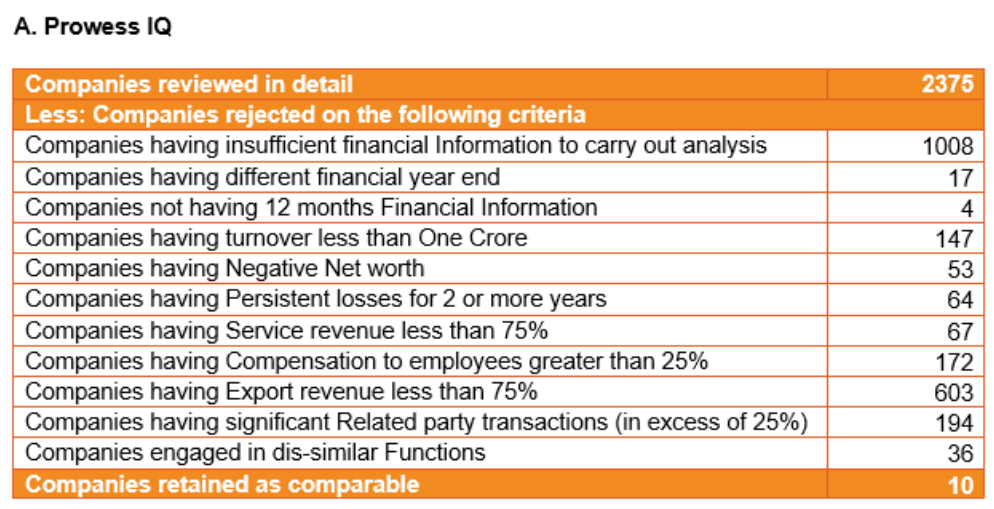
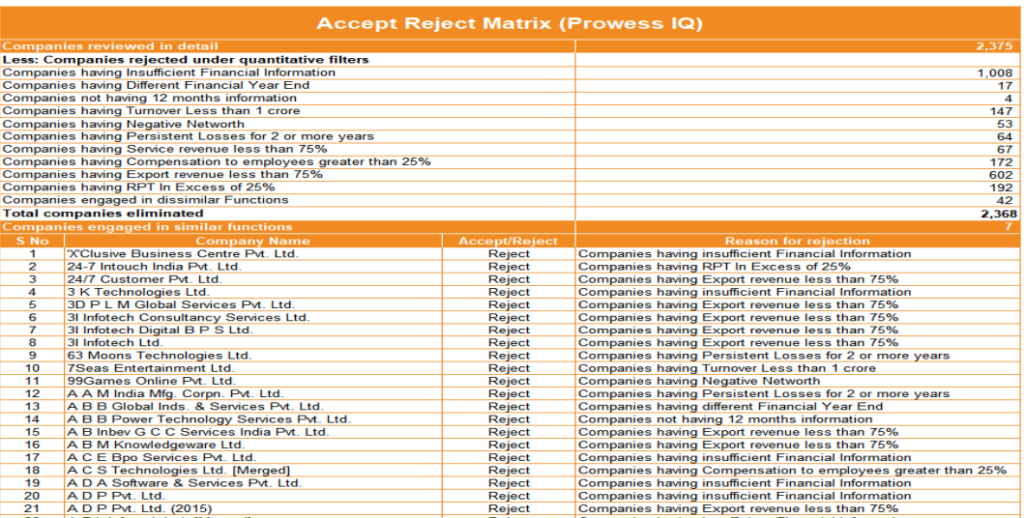
7.10 Accept Reject Matrix
Accept Reject Matrix: Displays the companies that have been accepted or rejected, which have been extracted from the Prowess search, along with the reasons for their acceptance or rejection. An Illustrative Example is provided below:
7.11 Prowess Case Study – Comparable Summary
Below is the final list of comparables that pass all the quantitative and qualitative filters specified earlier.
Among the six methods, TNMM has been selected as the most appropriate method, and OP/OC has been chosen as the PLI for the provision of software development services.
Range Concept has been used instead of Average Concept since there are more than 6 comparables.
Multiple year data has considered and had computed weighted average for the past three financial years data.
Since the No. of Comparable is even, Median will be average of 5 & 6.
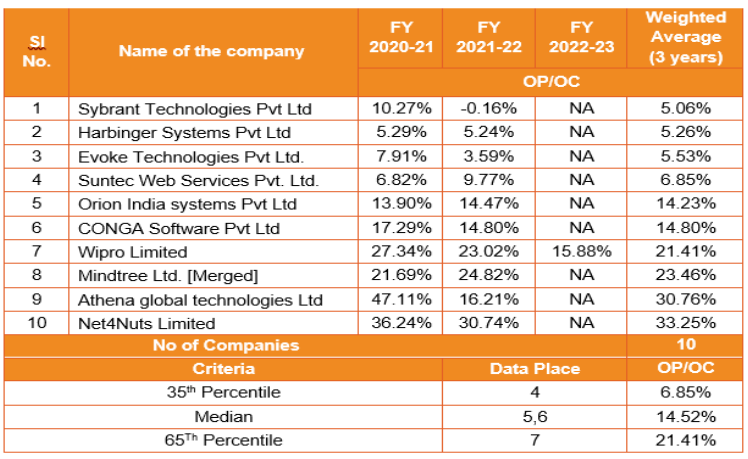
- Tested party Cost Plus mark up is 10%
- Since the tested party percentage is within the range transaction i.e., 6.85% to 21.41%, it can be said to be at Arm’s length.
- If the tested party margin is below the range, adjustment will be proposed.
8. Benchmarking 45 – Intragroup Loan
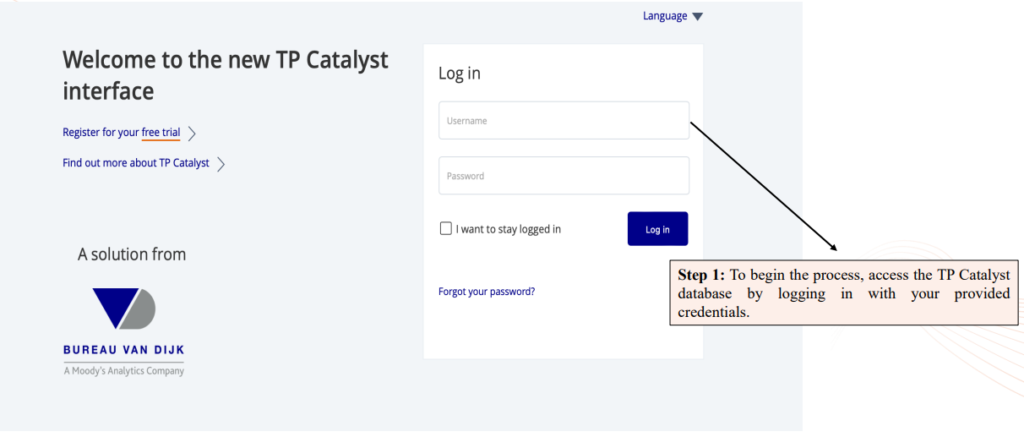
8.1 TP Catalyst – Login into TP Catalyst Interface
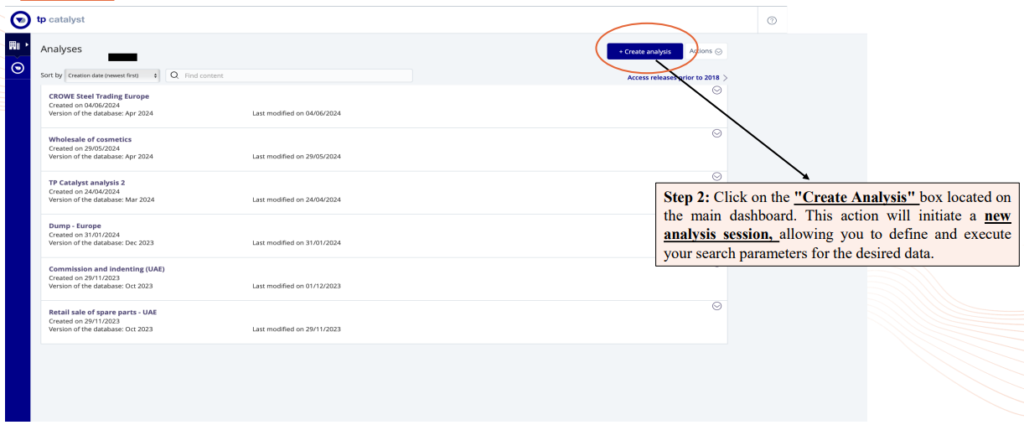
8.2 TP Catalyst – Create Analysis
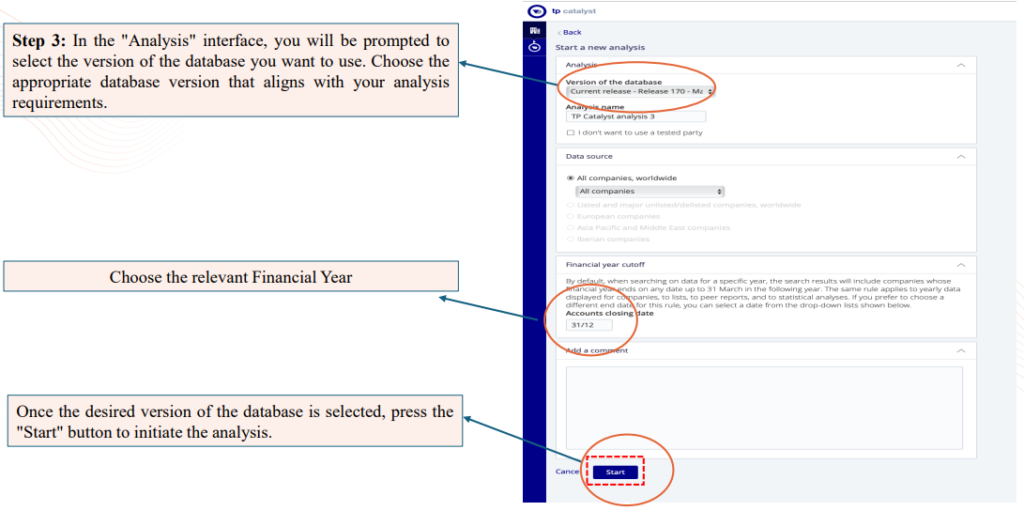
8.3 TP Catalyst – Selection of Database
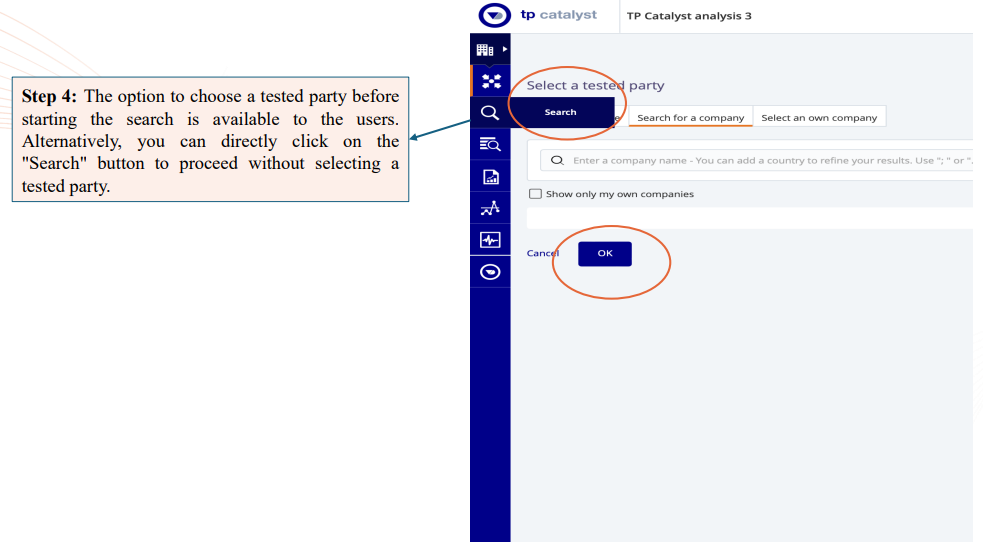
8.4 TP Catalyst – Selection of Tested Party
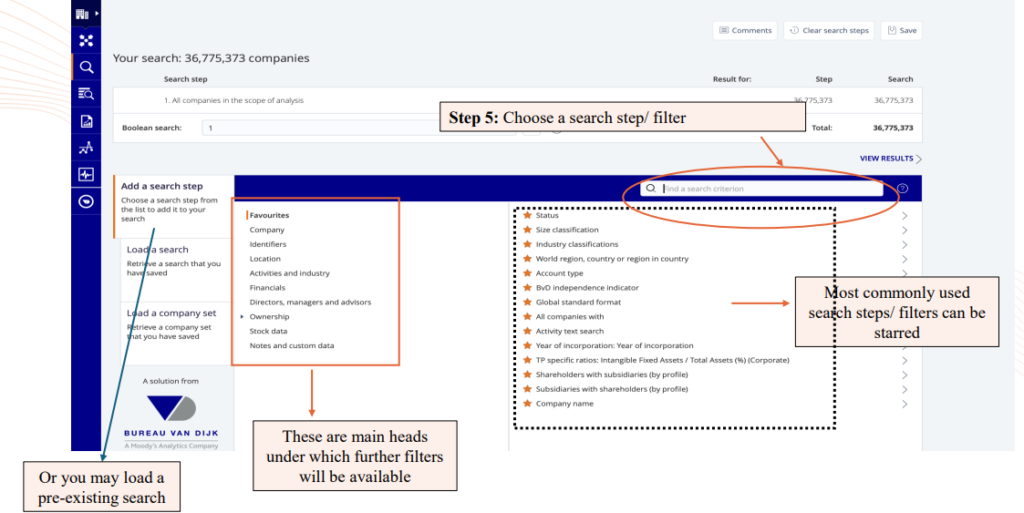
8.5 TP Catalyst – Filters
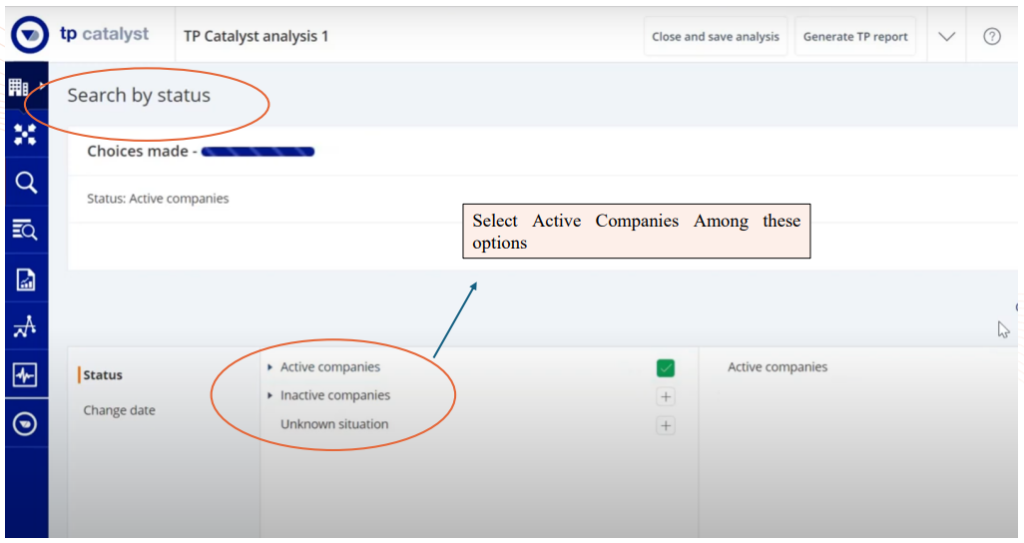
8.6 TP Catalyst – Status Filter
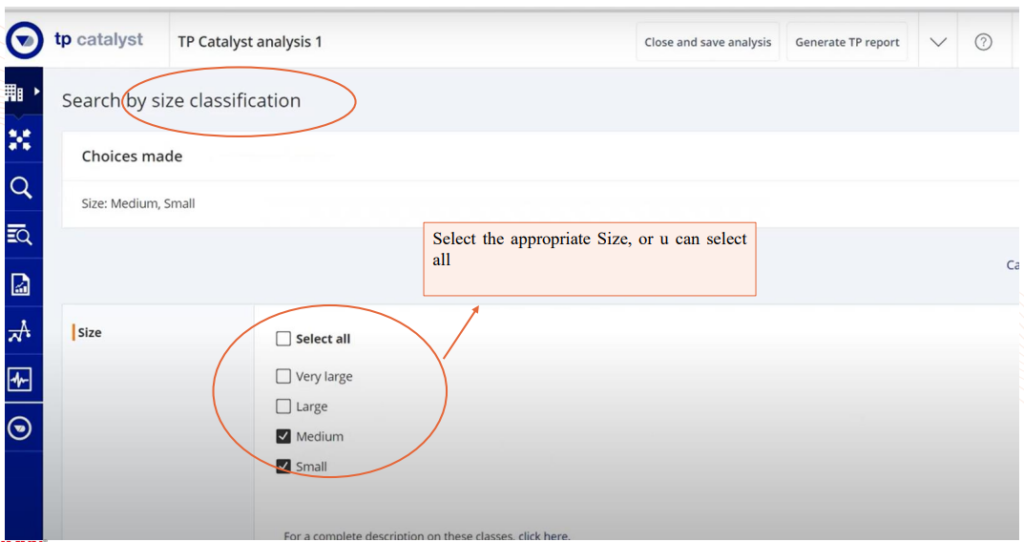
8.7 TP Catalyst – Size Classification
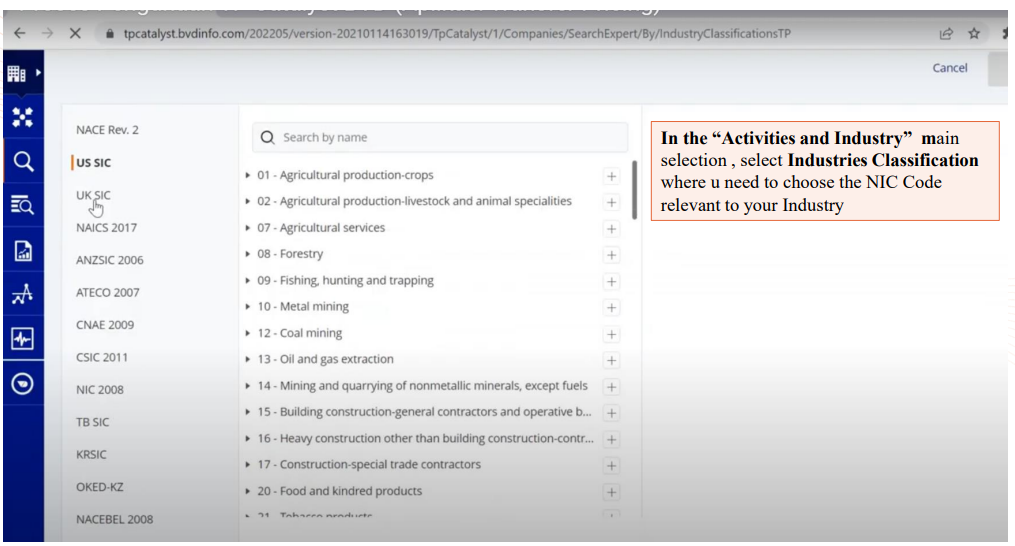
8.8 TP Catalyst – Industry Classification
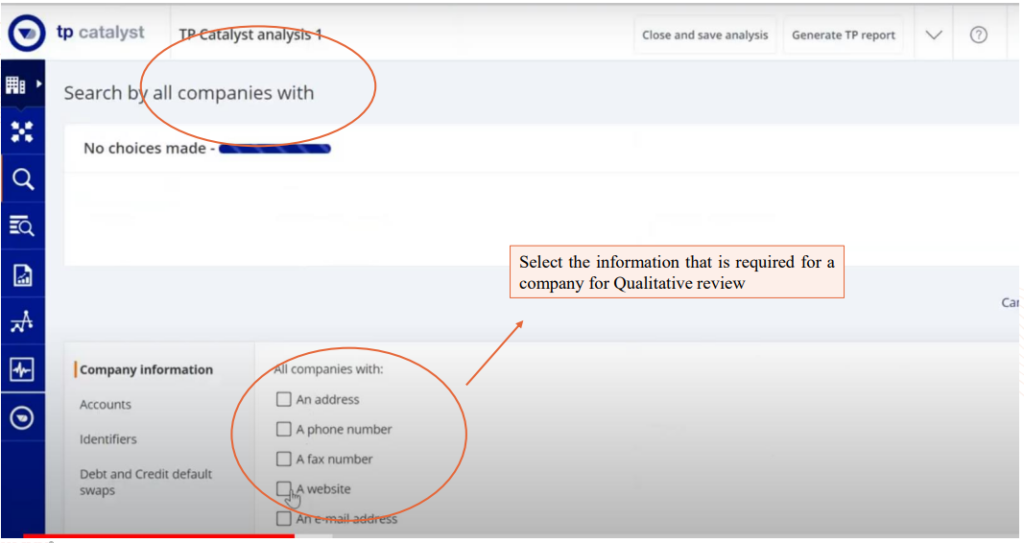
8.9 TP Catalyst – All Companies With
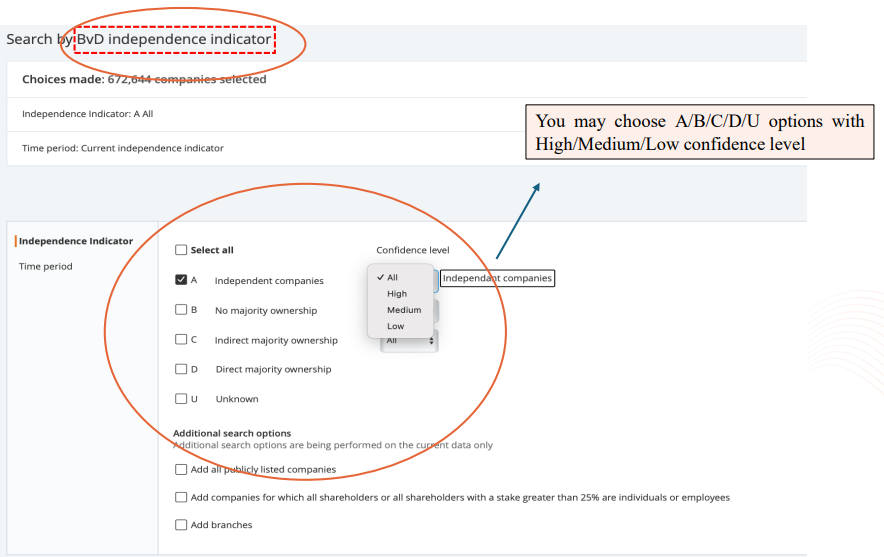
8.10 TP Catalyst – BvD Independence Indicator
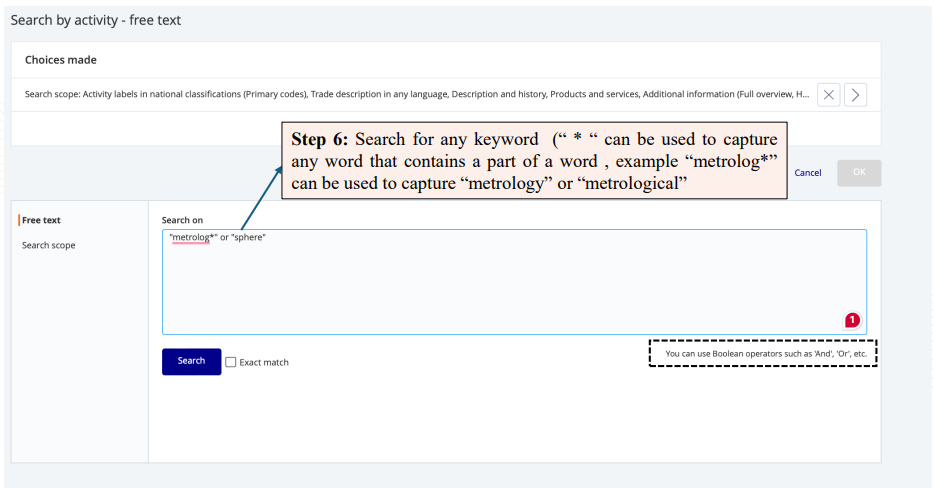
8.11 TP Catalyst – Activity Text Search
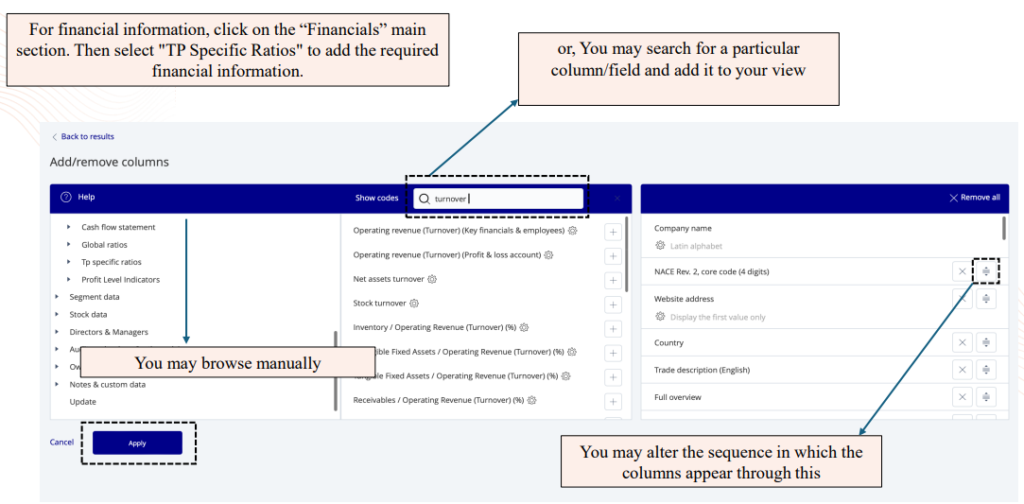
8.12 TP Catalyst – Financial Information
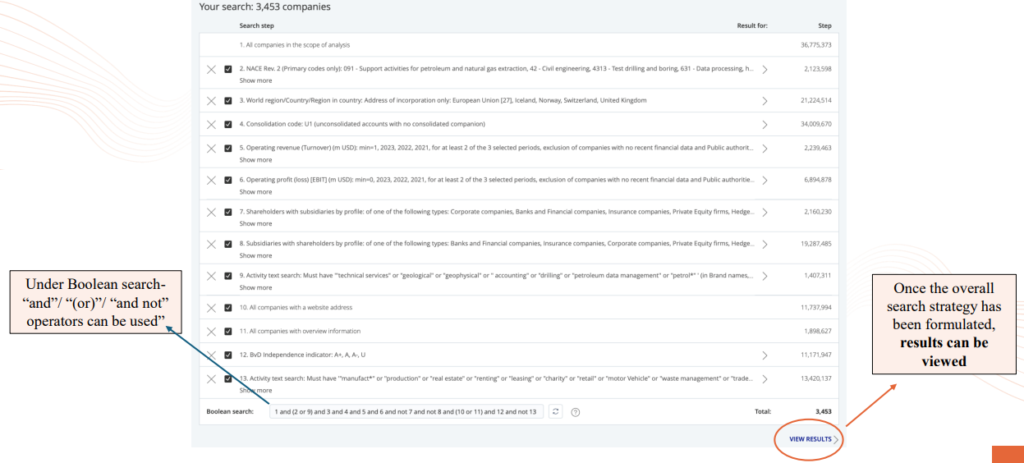
8.13 TP Catalyst – Search Strategy Screenshot
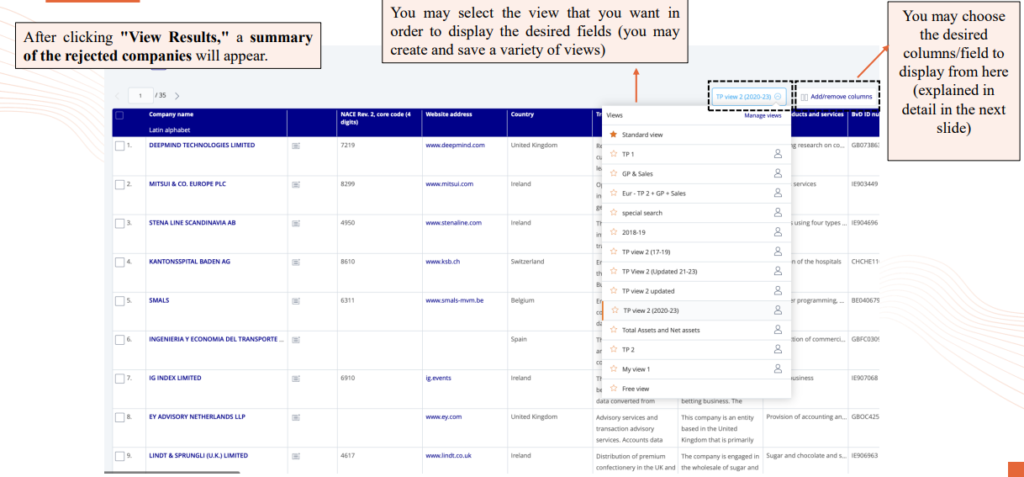
8.14 TP Catalyst – Comparable Results
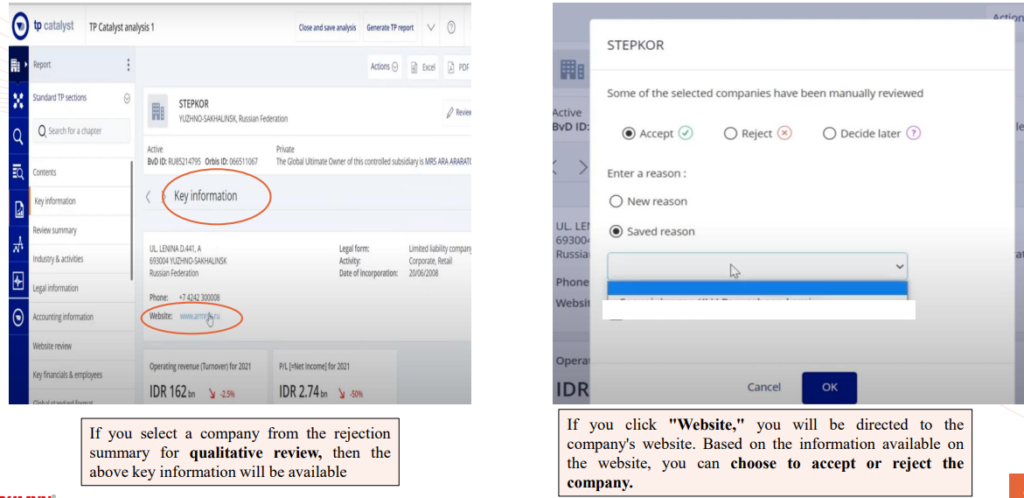
8.15 TP Catalyst – Qualitative review of Companies
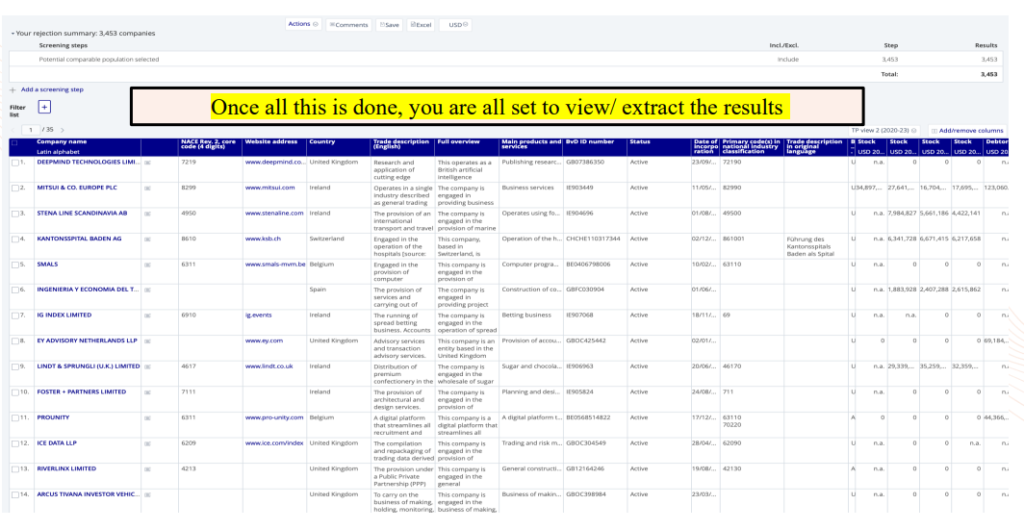
8.16 TP Catalyst – Generate Results
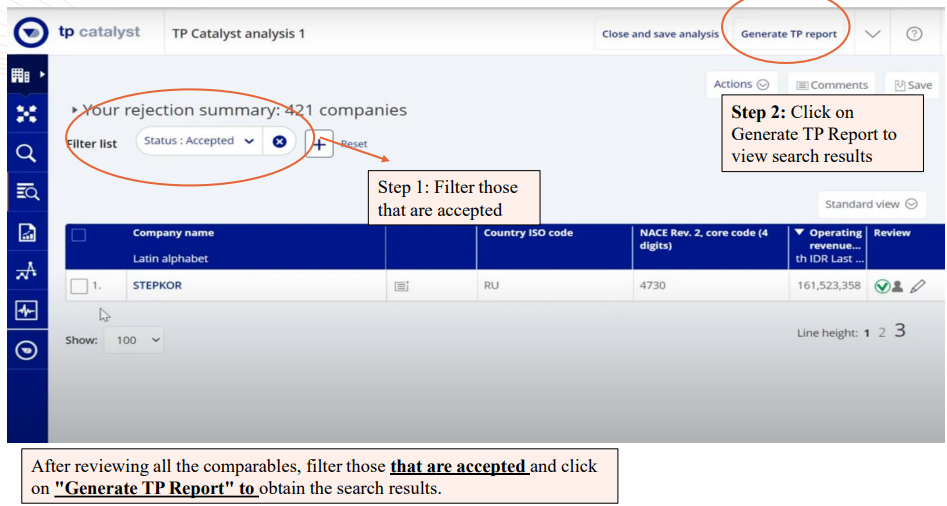
8.17 TP Catalyst – Final Results
8.18 Intra Group-loans
Procedure for establishing the arm’s length price,taking into account TP and ALP
- Analyze the terms of the loan that may impact the pricing including issue date, tenure, currency, interest rate etc.
- Analyze the credit rating of the borrower to understand the credit risk borne by the lender.
- Use reference of third-party loans with similar credit and terms as reference
- Calculate the arm’s length range
Transfer Pricing Methods
- Internal Comparable Uncontrolled Price (CUP)
-
- Bank transactions
- External CUP
-
- Comparable transactions from databases
- Yield curves, statistics (e.g., European Central Bank)
- Cost-plus – especially for pass-through
-
- Lender’s refinancing cost
Critical Issues
- Rating
-
- The choice between stand-alone and group ratings impacts perceived risk
- The lender’s substance affects loan terms,
- C+: C- rating suggests caution, with debt favored for retaining control and equity for risk-sharing (debt or equity financed loan?)
8.19 Credit Rating Methodology Framework
Step 1: Identify the members of a group
Step 2: Determine a group credit rating (GCP)
Step 3: Assess group status of group members: core, highly strategic, strategically important, moderately strategic, nonstrategic
Step 4: Determine if a stand-alone credit rating is required
- Core members receive a credit rating equivalent to GCP
- Strategic members receive a credit rating within three notches of GCP
Step 5: Assign a potential issuer credit rating based on:
- Criteria for insulated companies (Independent Companies, Less affected by changes in interest rates)
- External credit enhancements (Government support of financial guarantee)
Step 6: Apply constraints to potential issuer credit rating posed by:
- Sovereign risk
- Structural leverage
8.20 Credit Rating Table
| Moody’s Long-term | S&P Long-term | Fitch Long-term | Description | |||
| aa | P-1 | AAA | A-1+ | AAA | F1+ | Prime |
| Aa1 | P-1 | AA+ | A-1+ | AA+ | F1+ | High grade |
| Aa2 | P-1 | AA | A-1+ | AA | F1+ | High grade |
| A1 | P-1 | A+ | A-1 | A+ | F1 | Upper medium grade |
| A2 | P-1 | A | A-1 | A | F1 | Upper medium grade |
| A3 | P-1 | A- | A-1 | A- | F1 | Upper medium grade |
| Baa1 | P-2 | BBB+ | A-2 | BBB+ | F2 | Lower medium grade |
| Baa2 | P-2 | BBB | A-2 | BBB | F2 | Lower medium grade |
| Baa3 | P-3 | BBB- | A-3 | BBB- | F3 | Lower medium grade |
| Ba1 | Not prime | BB+ | B | BB+ | B | Non-investment grade speculative |
| Ba2 | Not prime | BB | B | BB | B | Non-investment grade speculative |
| Ba3 | Not prime | BB- | B | BB- | B | Non-investment grade speculative |
| B1 | Not prime | B+ | B | B+ | B | Highly speculative |
| B2 | Not prime | B | B | B | B | Highly speculative |
| B3 | Not prime | B- | B | B- | B | Highly speculative |
| Caa1 | Not prime | CCC+ | C | CCC+ | C | Substantial risks |
| Caa2 | Not prime | CCC | C | CCC | C | Extremely speculative |
| Caa3 | Not prime | CCC- | C | CCC- | C | Extremely speculative |
| Ca | / | CC | / | CC | / | Default imminent with little prospect for recovery |
| C | / | C | / | C | / | In default |
| / | / | D | / | DDD | / | In default |
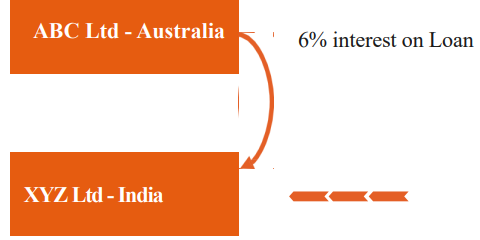
8.21 Practical Case Study
| Terms of the Loan | |
| Lender | XYZ Ltd |
| Lender Country | India |
| Borrower | ABC Ltd |
| Borrower Country | Australia |
| Loan Type | Unsecured Loan |
| Start Date | To be updated |
| Tenor | 1 Year and extendable as mutually agreeable |
| Principal | Upto AUD 120,000 |
| Currency of Interest payment | AUD |
| Currency of Principal repayment | AUD |
| Interest Rate Basis (Fixed/Floating) | Floating rate |
| Payment Frequency | Upon Maturity |
| Purpose of IC Loan | Financing the working capital requirements/General purposes. |
Illustrative Example
Search Criteria
| Search Criteria on Loan Databases | |
| Issue date | 01/01/2017 to 06/30/2018 |
| Original Maturity | 1 year |
| Credit Rating | ‘B- ‘B1, B2, B3, Ba1 to Ba3,Baa1to Baa3 |
| Currency | Australian Dollar (“AUD”) |
| Country of risk | Australia |
| Base Rate | Secured Overnight Financing Rate |
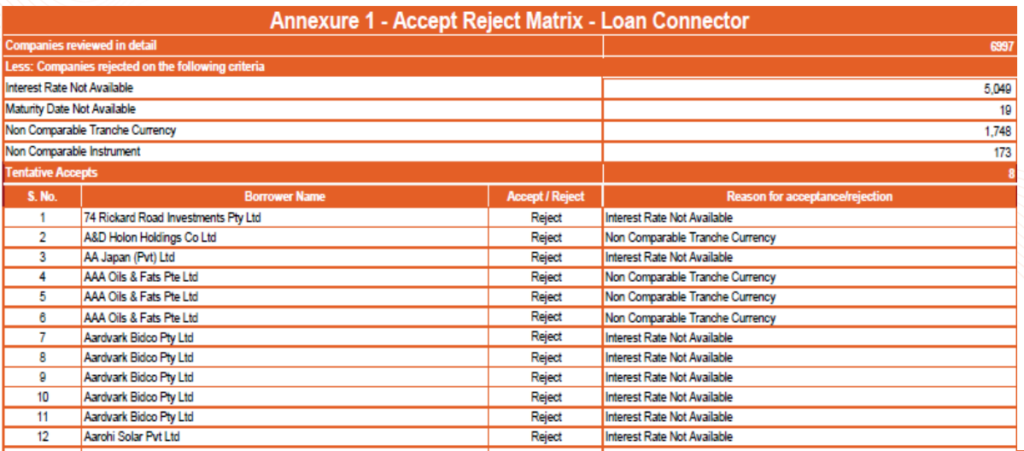
8.22 Accept Reject Matrix
Accept Reject Matrix: Display the companies that have been accepted or rejected, which have been extracted from the Loan Connector, along with the reasons for their acceptance or rejection.
An Illustrative Example is provided below:
8.23 Arm’s length range of Interest rates
Below is the final list of comparables that pass all the quantitative and qualitative filters specified earlier.
Among the six methods, CUP has been selected as the most appropriate method.
Range Concept has been used instead of Average Concept since there are more than 6 comparables.
Multiple year data has considered and had computed weighted average for the past three financial years data.
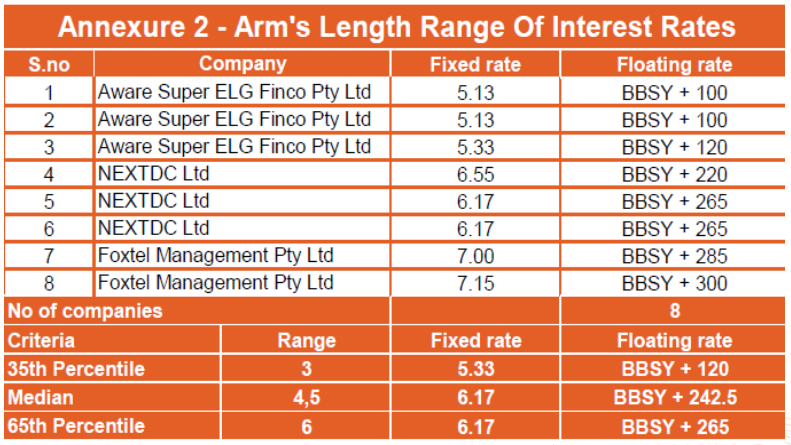
- Tested party receives interest rate at the rate of 6%
- Since the receipt of interest rate by tested party is within the range of comparable companies i.e., 5.33%% to 6.17%, it can be said to be at Arm’s length
9. Benchmarking – Intangibles
9.1 Benchmarking – Royalty Range
Illustrative Example
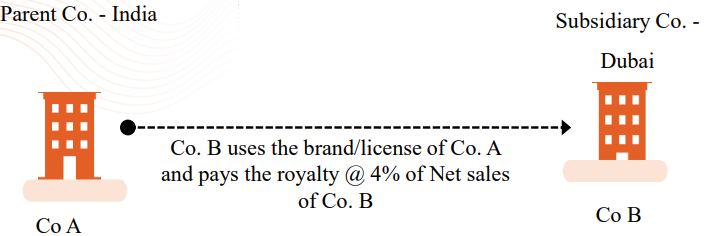
| Characteristics of the License | |
| Type of Intellectual Property | Intellectual Property rights |
| Effective Date | 6 May 2022 |
| License duration | 3 years from effective date |
| Currency | USD |
| Royalty rate | 4% |
| Business sector | Healthcare, Fashion Industry |
9.2 Royalty Range – Intangibles
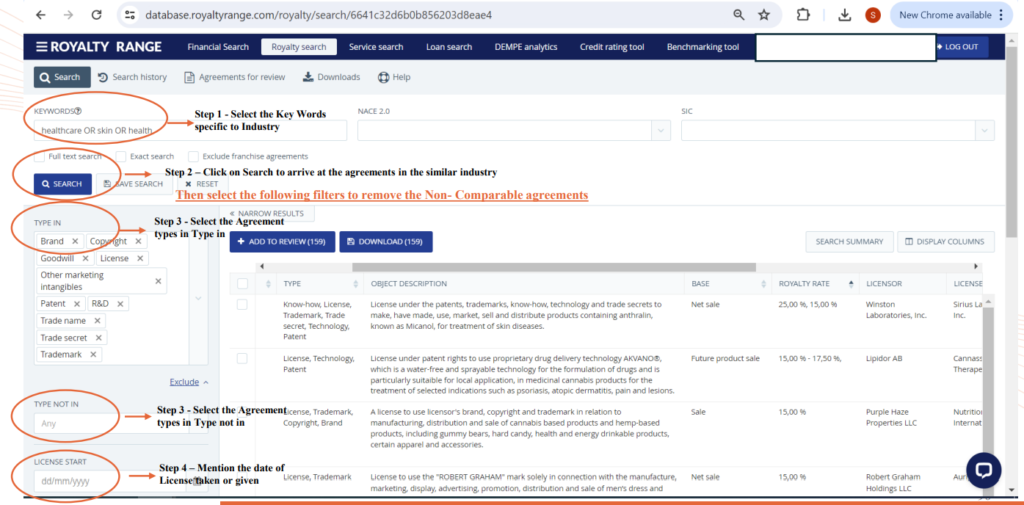
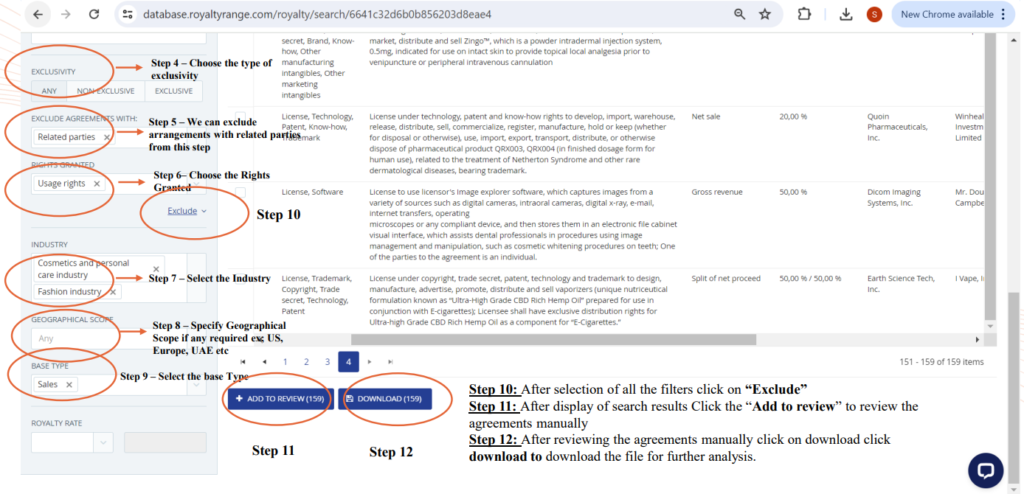
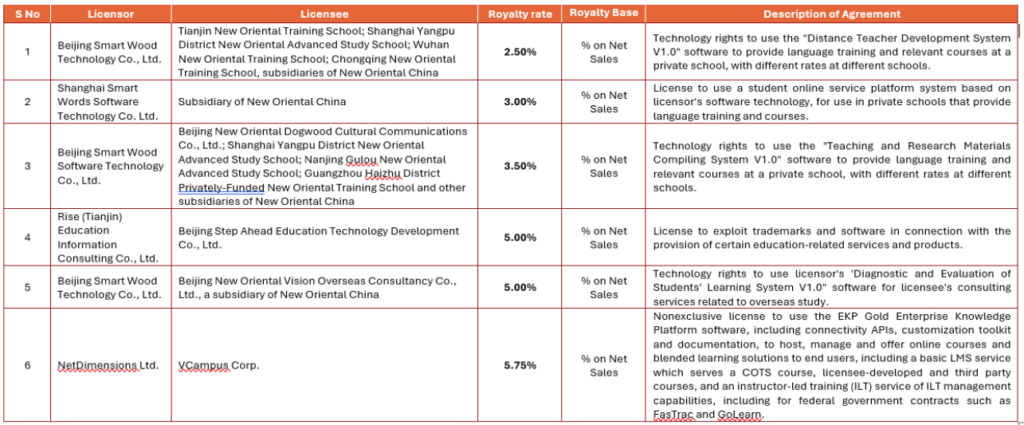
Search process conducted – Royalty Stat License Agreement database.
| Parameters | Characteristics | Number of Agreements |
| Industry | Environmental & Green Technologies Industry – Cooling Industries |
841 |
| Agreement Type | Copyrights, Trademark, Trade Name, | 357 |
| Agreement Type Excluding | Knowhow, Research and Trade Secrets | 102 |
| Royalty Base | Net Sales | 98 |
| Related Parties | Exclude | 91 |
| Final Remaining | Companies | 8 |
Qualitative analysis conducted on the initial set of agreements
| Description | Number of Agreements |
| Set of agreements extracted from the RoyaltyStat License Agreement database | 8 |
| Less: Agreements that include non-comparable functions – Qualitative review | 1 |
| Comparable Agreements | 7 |
9.3 AR Matrix
9.4 Arm’s Length Range
| Range | ALP Range of Royalty Rates |
| 35th Percentile | 3.50% |
| Median | 4.25% |
| 65th Percentile | 5.00% |
- Tested party royalty rate is 4% of net sales.
- Since the tested party percentage is within the range transaction i.e., 3.50% to 5.00%, it can be said to be at Arm’s length.
9.5 Addition of Comparables
- ABC Chart
| A | Comparables accepted by the TPO and Tax Payer |
| B | TPO Comparables rejected by the Tax Payer |
| C | Additional Comparables Proposed by Tax Payer |
- Search for comparables can be updated during the assessment proceedings
- Include companies accepted last year even if they fall outside the current relevant ‘product classifications’ after ensuring no new reasons for rejection have surfaced.
- If a company which was accepted last year, but was not present on the current database, then we should include this company for both previous and current years after confirming no change in the underlying basis for acceptance and no substantive reasons for its absence. Please note that the above tow positions should only be adopted for updation of study but not for a benchmarking/new study.
- In the event of Annual Report review if any subsidiaries or group companies of potentially acceptable companies are identified include this company, even if they are not part of the database.
- Even if the Client insists on cherry picking of comparables to be with in the range, it should not be done. There should be a proper basis for the selection of comparables.
9.6 Do’s and Don’ts for TP
9.6.1 Related Party Transaction
Do’s: Consider only transactions with relating parties during the relevant year
Don’ts: Do not consider outstanding balances as at the end of the relevant year
9.6.2 Export Filter
Do’s: To be considered only for International Transaction
Don’ts: Do not consider while evaluation domestic transactions
9.6.3 TP Methods
Do’s: Evaluate the applicability of all the methods
Don’ts: Avoid proceeding directly to TNMM
9.6.4 Benchmarking exercise
Do’s: Consider the jurisdictions of both entities during the benchmarking exercise.
Don’ts: It should be not be carried out from only one perspective
9.6.5 Selection of Tested Party
Do’s: Entity that performs least complex functions and has lower risks must be selected as tested party.
Don’ts: Do not change/shift the tested party without any base
9.6.6 Selection of Comparable
Do’s: Evaluate and select the comparables after applying all the quantitative and qualitative filters
Don’ts: Cherry picking of companies is not acceptable
9.7 India v/s UAE TP Regulations
| # | India TP Regulations | UAE TP Regulations |
| Coverage |
|
|
| TP Methods |
|
|
| ALP computation |
More than 6 comparable: 35th to 65th Percentile |
Inter-quartile range is recommended (25th to 75th Quartile) |
| Multiple vs Single Year data |
|
|
| Comparable Selection |
|
|
| Tested Party |
|
|
| TP Adjustments |
|
|
| TP database | No preferred TP databases
Below are recommended:
|
Below are recommended:
|
| TP Compliances |
|
|
| Domestic Litigation Framework |
|
|
| Safe Harbour Rules |
|
|
| APA Regime |
|
|
| Overdue receivables |
|
|
| Special considerations |
|
|

Disclaimer: The content/information published on the website is only for general information of the user and shall not be construed as legal advice. While the Taxmann has exercised reasonable efforts to ensure the veracity of information/content published, Taxmann shall be under no liability in any manner whatsoever for incorrect information, if any.
Taxmann Publications has a dedicated in-house Research & Editorial Team. This team consists of a team of Chartered Accountants, Company Secretaries, and Lawyers. This team works under the guidance and supervision of editor-in-chief Mr Rakesh Bhargava.
The Research and Editorial Team is responsible for developing reliable and accurate content for the readers. The team follows the six-sigma approach to achieve the benchmark of zero error in its publications and research platforms. The team ensures that the following publication guidelines are thoroughly followed while developing the content:
- The statutory material is obtained only from the authorized and reliable sources
- All the latest developments in the judicial and legislative fields are covered
- Prepare the analytical write-ups on current, controversial, and important issues to help the readers to understand the concept and its implications
- Every content published by Taxmann is complete, accurate and lucid
- All evidence-based statements are supported with proper reference to Section, Circular No., Notification No. or citations
- The golden rules of grammar, style and consistency are thoroughly followed
- Font and size that’s easy to read and remain consistent across all imprint and digital publications are applied

