What is Terminal Value in Valuation – Definition | Approaches | Importance
- Blog|Company Law|
- 8 Min Read
- By Taxmann
- |
- Last Updated on 25 November, 2024

Terminal Value (TV) in valuation represents the value of a business beyond the explicit forecast period, assuming it will continue generating cash flows indefinitely. It consolidates long-term projections into a single figure, bridging short-term forecasts with long-term assumptions about economic viability and industry performance. Terminal Value is critical in approaches like the Income Approach, where it captures future cash flows beyond the forecast, and the Market Approach, where it is reflected through valuation multiples. Often the largest component of a valuation, it provides insights into the scalability, legacy, and potential profitability of a business, especially for stakeholders such as founders, investors, and valuers.
Table of Contents
1. Need For Valuation
1.1 When do you need a valuation?
1.1.1 Financial Reporting
- Purchase price allocation
- Impairment analysis
- Financial instruments
- ESOPs
1.1.2 Regulatory
- RBI/FEMA/SEBI
- Income Tax purposes (& court cases)
- Insolvency And Bankruptcy Code, 2016
- Companies Act, 2013 & rules thereunder
1.2 Valuation Approaches & Methods
1.2.1 Market Approach
- Market Price Method
- Comparable Companies Multiple Method
- Comparable Transaction Multiple Method
1.2.2 Income Approach
- Discounted Cash Flow Method
- Earning Capitalization Method
- Dividend Discount Model
- Intangible Asset Valuation
-
- Relief from Royalty Method
- Multi-Period Excess Earning Method
- With or Without Method
- Option Pricing Models
1.2.3 Cost Approach
- Replacement Cost Method
- Reproduction Cost Method
1.3 What is Terminal Value (TV)?
1.3.1 Definition
- Represents the value of a business beyond the explicit forecast period in a valuation model.
- It assumes the company will continue generating cash flows indefinitely.
1.3.2 Beyond Valuation
- Represents the legacy value of a business.
- Stakeholders
- Founders: Captures their vision
- Investors: Represents their faith in management
Acts as a bridge between short-term forecasts and long-term assumptions about economic viability and industry performance.
1.3.3 How does TV fit into different Valuation Approaches?
Income Approach
- Terminal Value is explicitly calculated as a separate component,
- Capturing the value of future cash flows beyond the forecast period.
Cost & Market Approach
TV is implicitly embedded:
- Market Approach: Reflected through valuation multiples (e.g., EBITDA or Revenue), inherently accounting for long-term growth.
- Cost Approach: Captured as the residual asset value, with little focus on future earnings.
Beyond the Basics
TV includes not just operational cash flows but also potential synergies from future mergers and acquisitions.
1.4 Why is Terminal Value (TV) Required?
1.4.1 Why TV?
- Consolidates the complexity of long-term projections into a single, comprehensible figure.
- Terminal Value allows businesses of different sizes and life stages to be compared on a similar footing.
- Capturing Intangible Potential: Many high-growth startups (e.g., SaaS, EV mfgs) rely on Terminal Value to demonstrate their potential beyond the current growth phase.
- Mitigating Forecasting Limitations
1.5 Impact of Macroeconomic Factors on Terminal Value
1.5.1 Currency Volatility
- Exchange rate fluctuations alter the value of foreign cash flows, significantly affecting MNCs.
- Example: A pharmaceutical firm sees its Terminal Value drop by 25% due to a weakening Euro, reducing revenue in USD terms.
1.5.2 Market Cycles
- Bull markets inflate growth expectations and multiples, while bear markets suppress them.
1.5.3 Regulatory Environment
- Tax reforms, environmental regulations, or trade barriers directly impact profitability and long-term projections.
1.5.4 Inflation
- Persistent inflation erodes real cash flows and shrinks margins, reducing sustainable growth (𝑔).
1.5.5 Discount Rates
- Higher rates increase WACC, reducing Terminal Value.
- Example: Post-rate hike environments lead to lower present values.
1.6 Importance of Terminal Value in Valuation
1.6.1 Founder
- Legacy and Vision
-
- TV quantifies the long-term scalability and success of their business model.
- It Represents the legacy of the business
- Capital Allocation: Helps founders justify investments in long-term assets or R&D by linking them to potential future gains.
- Brand Equity Valuation: For founders of strong consumer-facing brands (e.g., Apple, Coca-Cola), TV reflects their brand’s perpetual market strength
1.6.2 Investor
- Exit Strategy Insights: Investors often use TV as a benchmark for potential M&A deals or IPO valuation.
- Risk Assessment: TV provides a cushion for higher risks in early-stage investments, showing long-term profitability potential.
- Return Optimization: TV-focused strategies help identify businesses with high future growth and minimal current profitability (e.g., Amazon’s early years).
1.6.3 Valuer
- Accuracy & Credibility: TV is often the single largest component of valuation, making accuracy paramount for credibility.
- Reconciling Models: Allows valuers to validate results using multiple approaches (e.g., comparing Perpetuity Model vs. Exit Multiple).
1.7 Ways of Estimating Terminal Value
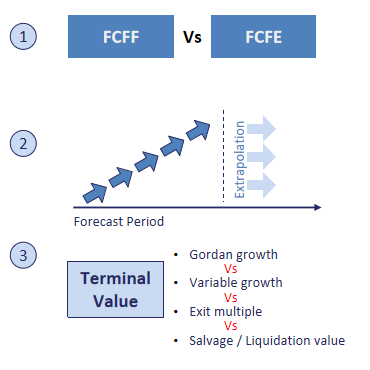
1.7.1 TERMINAL VALUE
Liquidation Approach
- Most useful when assets are separable & Marketable.
- Usually for distressed companies
Multiple Approach
- Easiest approach
- But makes the valuation a relative valuation
Income Approach
Gordon Approach: Assumes the company grows perpetually at a stable rate (g) derived from macroeconomic trends or industry norms.
Variable Growth: Models different growth phases (e.g., high-growth to stable growth) to capture a company’s lifecycle transition.
2. Income Approach
2.1 Overview Income Approach
Income Approach requires a lot more deeper insights to shortlist the key valuation parameters
- Company Background
- Management Business Plan
- Free Cashflows
- Discount Rate
- Business cycle/Key sensitivities

2.2 FCFF vs FCFE
2.2.1 Free Cash Flows to Equity
- Valuation of equity stake in business
- Based on expected cash flows – net of all outflows, including tax, interest and principal payments, reinvestment needs
| MINR | |
| PAT | |
| Add: Depreciation | |
| Less: Capital Expenditure | |
| (Add)/Less: Increase/(Decrease) in Working Capital* | |
| Add/(Less): Borrowings/Loan Repayment | |
| Free Cash Flow to Equity (FCFE) |
*Non-Cash Non-Debt Net Working Capital
2.2.2 Free Cash Flows to Firm
- Value of firm for all the stakeholders – lenders and equity investors
- Net of tax but prior to debt payments
- Measures free cash flow to firm before all financing costs
- Business Value independent of the capital structure
| MINR | |
| EBITDA | |
| Less: Tax (tax on PBIT) | |
| Less: Capital Expenditure | |
| Less: Increase/(Decrease) in Working Capital* | |
| Free Cash Flow to Firm (FCFF) |
2.3 Gordon Growth & Variable Growth – Concept
2.3.1 Gordon Growth
- Assumes the company continues indefinitely with a steady growth rate.
- Best suited for mature, stable businesses like utility companies (e.g., Duke Energy or Procter & Gamble) that have predictable, steady cash flows and modest growth rates.
2.3.2 Variable Growth
- Recognizes that businesses transition through phases:
-
- High Growth: Rapid expansion phase.
- Transition: Gradual slowdown in growth.
- Stable Growth: Long-term, steady state.
- Ideal for high-growth industries transitioning to maturity, such as SaaS companies (e.g., Shopify) or biotech firms during periods of innovation (e.g., Moderna during its COVID-19 vaccine phase).
2.4 Gordon Growth & Variable Growth – Pros & Cons
| Approach | Pro’s | Con’s |
| Gordon Growth |
|
|
| Variable Growth
|
|
|
2.5 Gordon Growth & Variable Growth – Formula & Application
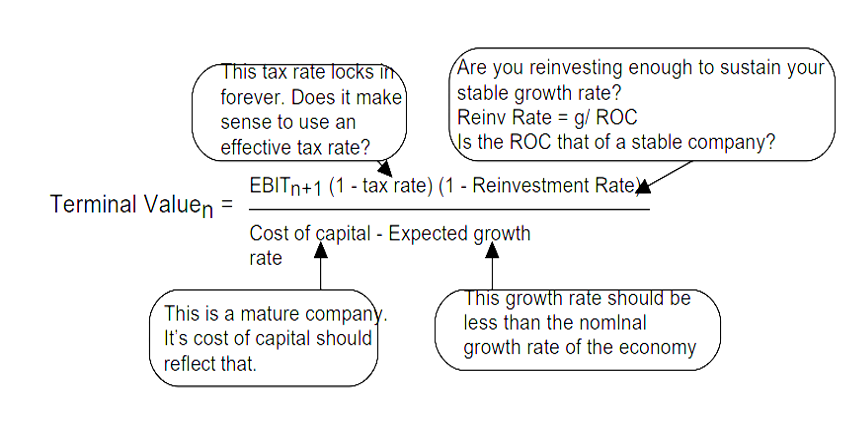
TV = (FCF t+1)/(Ke -g)
FCF in the last year of projection*(1+growth rate)/(Discounting Factor – growth rate)
- Cost of Equity (Re): Use the Capital Asset Pricing Model (CAPM).
- CAPM Formula: Re = Rf + β × (Rm – Rf)
- Rf: Risk-free rate, often derived from the current yield on 10-year government bonds.
- β: Adjusted beta reflecting the company’s sensitivity to market movements
- Rm – Rf: Source: Industry-standard reports or country-specific premium tables.
2.6 Simplifying WACC
- Additional Considerations
-
- Company-specific risks: Adjust beta for size or sector-specific risks.
- Emerging markets: Add country risk premium to Ke for valuations in volatile regions.
- Cost of Debt (Kd): Use the company’s current borrowing rates or yields on comparable bonds.
- Tax Considerations
- Apply the marginal corporate tax rate to interest expenses.
- For multi-jurisdictional companies:
-
-
- Adjust tax rates based on the weighted contribution of cash flows by region.
- Incorporate any expected changes in tax policy.
-
2.7 Alternate Formula

2.8 Terminal Value Calculation via Gordon Model

3. Exit Multiple Approach
3.1 Exit Multiple Approach – Conceptual Understanding
Applying a market-derived multiple (e.g., EV/EBITDA, EV/Revenue) to the company’s financial metric at the end of the explicit forecast period.
- Choose a relevant metric based on industry and business stage
- Identify Comparable Companies with similar size, growth, profitability, and capital structure, Geography
- Precedent Transactions: Analyze multiples from recent M&A deals in the industry.
- Normalize financials for non-recurring items, accounting policies, and capital structures
- Discount the amount and incorporate it into DCF Analysis
Beyond the Basics
- EBITDA Multiple: Commonly used for capital-intensive industries due to its focus on operating performance.
- Revenue Multiple: Useful for startups or industries with high growth potential but inconsistent profitability (e.g., SaaS).
3.2 Terminal Value Calculation via Exit Multiple Approach
Example: Indian Renewable Energy Company
Company: EcoSpark Energy – Operates Solar Farms & Ancillary Services
Projected Financials: Final forecast year revenue: ₹1,000 crore.
EBITDA Margin: 40%.
Peer Profile:

Average EV/EBITDA: 27.22
Terminal Value
- Metric X Market Multiple
- 400 Crore X 27.22
- 10,889 Crores
Discount this amount by WACC of last year of forecast period & incorporate in DCF
Considerations
- Market Conditions: Adjust multiples for market cycles (bull vs. bear markets).
- Size Premiums
- Discount on Lack of Liquidity: Applied to value of closely held and Restricted Shares
3.3 Income & Multiple Approach – Pros & Cons
| Approach | Pro’s | Con’s |
| Income Approach
|
|
Highly sensitive to growth rate assumptions |
| Exit Multiple |
|
Market multiples can be volatile; may not capture long-term value. |
Beyond the Basics: Perform both calculations and reconcile differences.
4. Liquidation Approach
4.1 Salvage/Liquidation Method – Concept
- This method calculates Terminal Value (TV) based on the realizable market value of a company’s tangible and intangible assets after deducting all liabilities and liquidation costs.
- Typically used when a company is expected to cease operations or in highly distressed scenarios.
Distress Discounts
Asset values may be heavily discounted if the company is in a forced-sale scenario.
Formula
TV = Realizable Asset Value – Liabilities – Liquidation Costs
- Realizable Asset Value: Market value of land, equipment, inventory, and intangibles (like IP or goodwill).
- Liabilities: Debt, taxes, and obligations.
- Liquidation Costs: Costs incurred during the sale process (e.g., legal fees, transaction costs).
4.2 Common Pitfalls in TV Calculation and How to Avoid Them
4.2.1 Overly optimistic growth rates
Problem: Assuming high perpetual growth rates that exceed long-term economic growth or industry trends
Solution
- Anchor growth assumptions to macroeconomic indicators (e.g., GDP growth, inflation).
- Benchmark growth rates against peers and historical company performance.
4.2.2 Ignoring Capital Needs
Problem: Failing to account for reinvestments required to sustain growth.
Solution
- Include maintenance CapEx (to preserve existing operations).
- Incorporate growth CapEx (to support expansion).
4.2.3 Assuming Constant Margins
Problem: Unrealistically projecting stable margins despite competitive pressures.
Solution: Factor in potential margin compression from increased competition or market saturation. Model declining profitability in mature phases for cyclical industries.
4.2.4 Misaligned Time Horizons
Problem: Terminal value is calculated for a year that does not represent a steady state
Solution: Ensure the terminal year reflects a normalized, steady-state operation, not a peak or trough.
4.3 Common Myths
- The only way to estimate TV is to use perpetual growth model –> The terminal value can be based on annuities or a liquidation value
- The perpetual growth model can give you infinite value –> Not if growth forever is capped at the growth rate of the economy
- The growth rate is your biggest driver of TV –> Growth is not free & increasing growth can add or destroy value
- Your growth rate cannot be negative in a perpetual growth model –> Growth can be negative forever & is often more reflective of reality
- If Your TV is a high proportion of DCF value , it is flawed –> The terminal value should be a high percent of value today
Disclaimer: The content/information published on the website is only for general information of the user and shall not be construed as legal advice. While the Taxmann has exercised reasonable efforts to ensure the veracity of information/content published, Taxmann shall be under no liability in any manner whatsoever for incorrect information, if any.

Taxmann Publications has a dedicated in-house Research & Editorial Team. This team consists of a team of Chartered Accountants, Company Secretaries, and Lawyers. This team works under the guidance and supervision of editor-in-chief Mr Rakesh Bhargava.
The Research and Editorial Team is responsible for developing reliable and accurate content for the readers. The team follows the six-sigma approach to achieve the benchmark of zero error in its publications and research platforms. The team ensures that the following publication guidelines are thoroughly followed while developing the content:
- The statutory material is obtained only from the authorized and reliable sources
- All the latest developments in the judicial and legislative fields are covered
- Prepare the analytical write-ups on current, controversial, and important issues to help the readers to understand the concept and its implications
- Every content published by Taxmann is complete, accurate and lucid
- All evidence-based statements are supported with proper reference to Section, Circular No., Notification No. or citations
- The golden rules of grammar, style and consistency are thoroughly followed
- Font and size that’s easy to read and remain consistent across all imprint and digital publications are applied


 CA | CS | CMA
